Charts and graphs documenting the financial crisis
The global financial crisis and Great Recession of 2007–2009 constituted the worst shocks to the United States economy in generations. Many books have been and will be written about these seminal events, but the story can also be told graphically, as the charts and graphs below aim to do.
No collection of charts, even as extensive as this, can convey all the complexities and details of the crisis and the government's interventions. But the charts presented here capture the essential features of one of the worst episodes in American economic history and the ultimately successful, even if politically unpopular, government response.
We hope that you will take the time to explore all of the charts and encourage you to share them with colleagues, students, and other financial policy professionals. You may download and utilize the charts in your own work, and in some cases, you may explore the underlying data. The charts and data may be used free of charge in accordance with our terms described below.
Financial Crisis Chart Archive
Antecedents of the Crisis
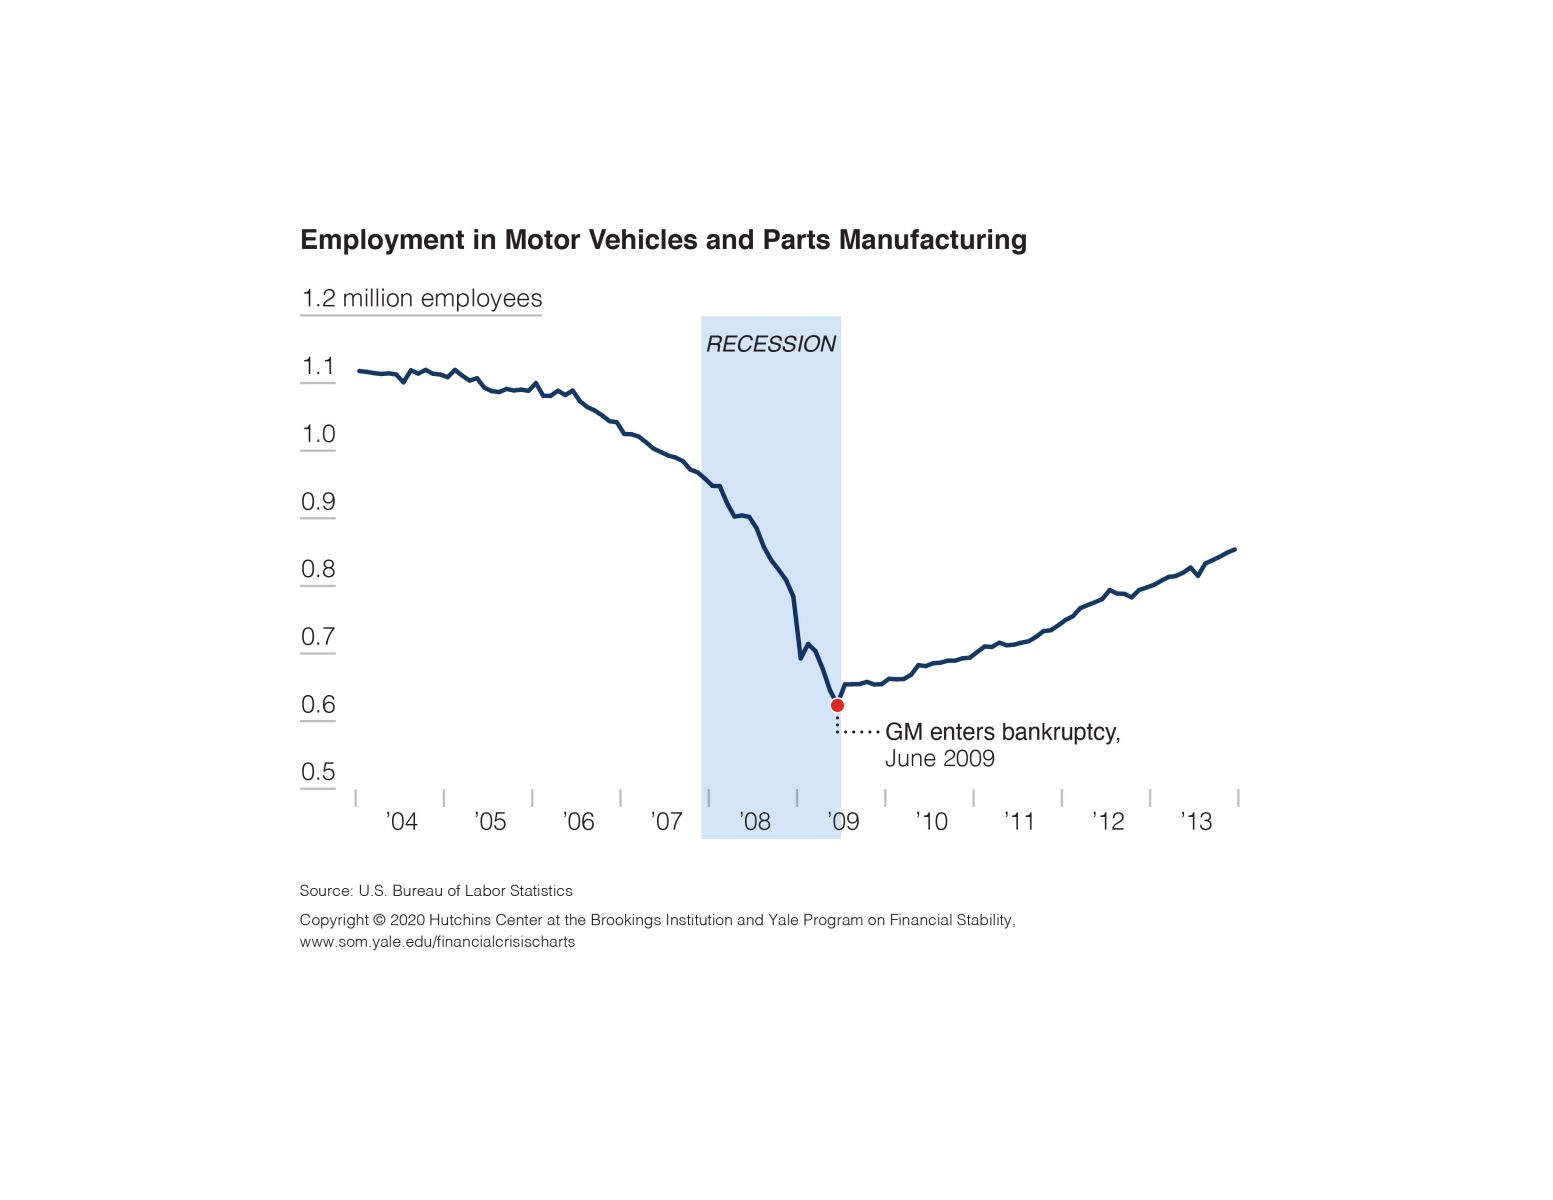
Growth in Real Potential GDP from Productivity Growth and Labor Force Growth, 1970–2008
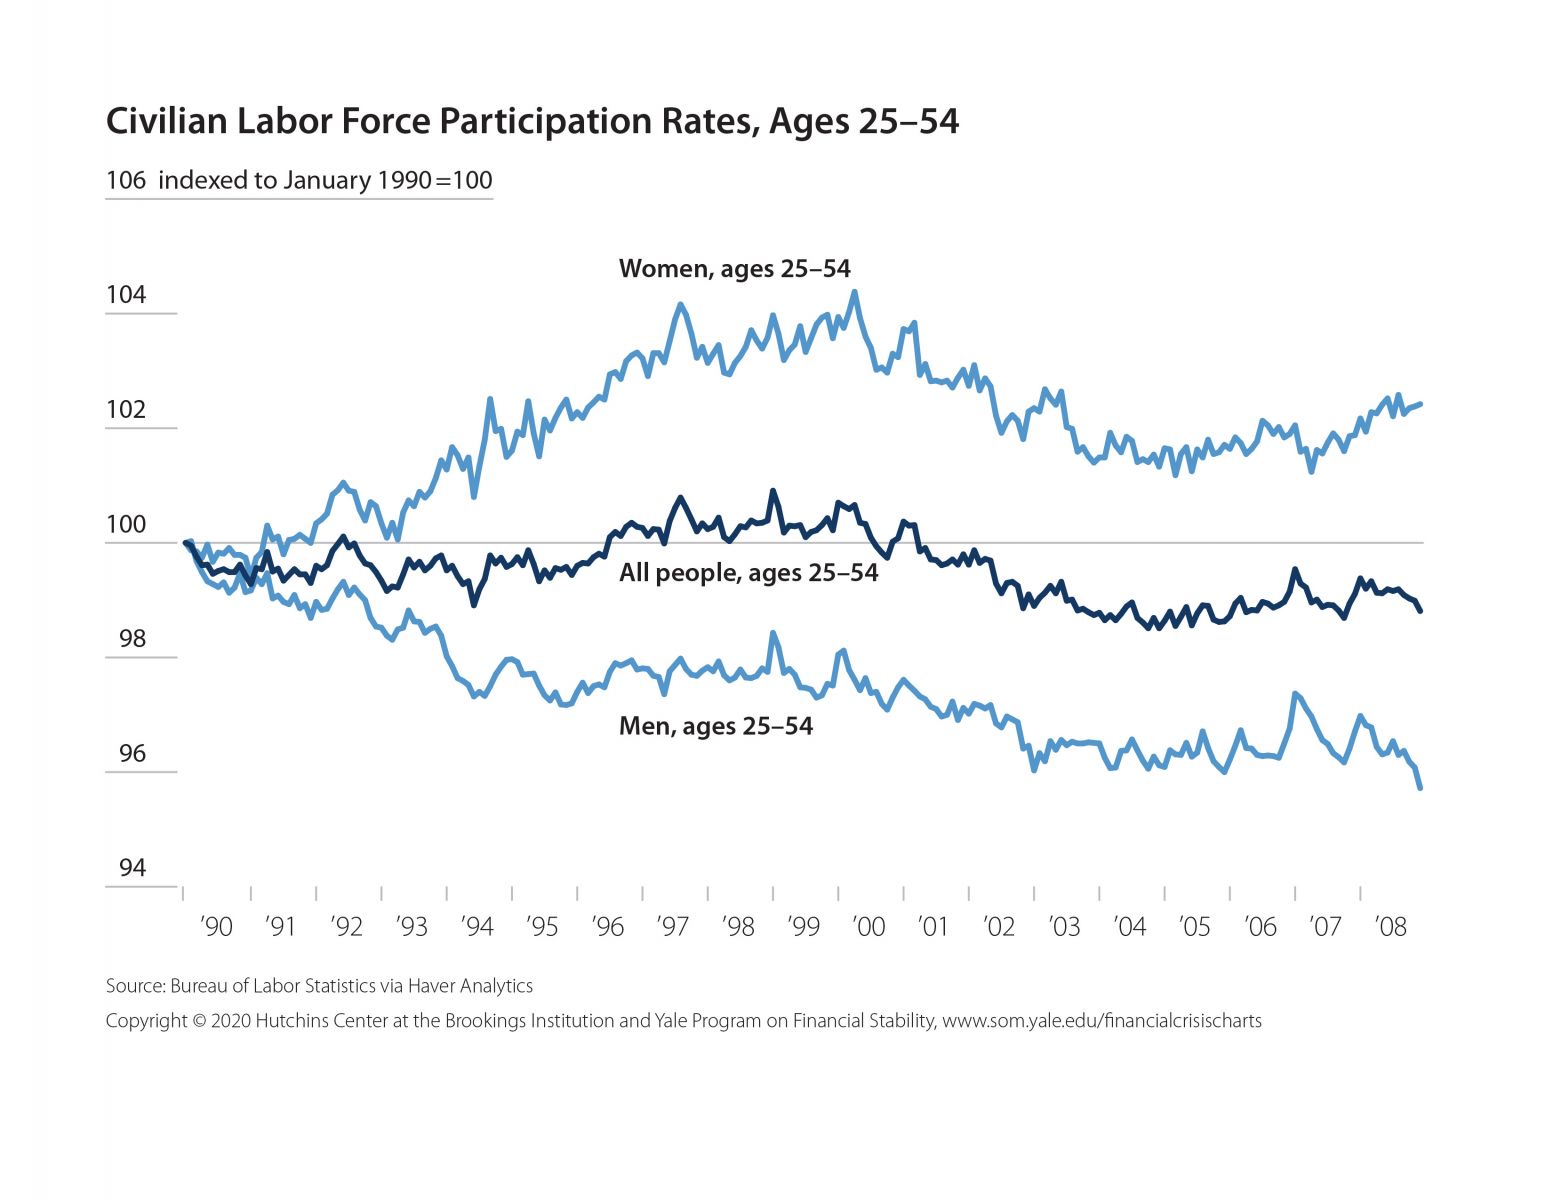
Civilian Labor Force Participation Rates, Ages 25–54, 1990–2008 (indexed to 1990)
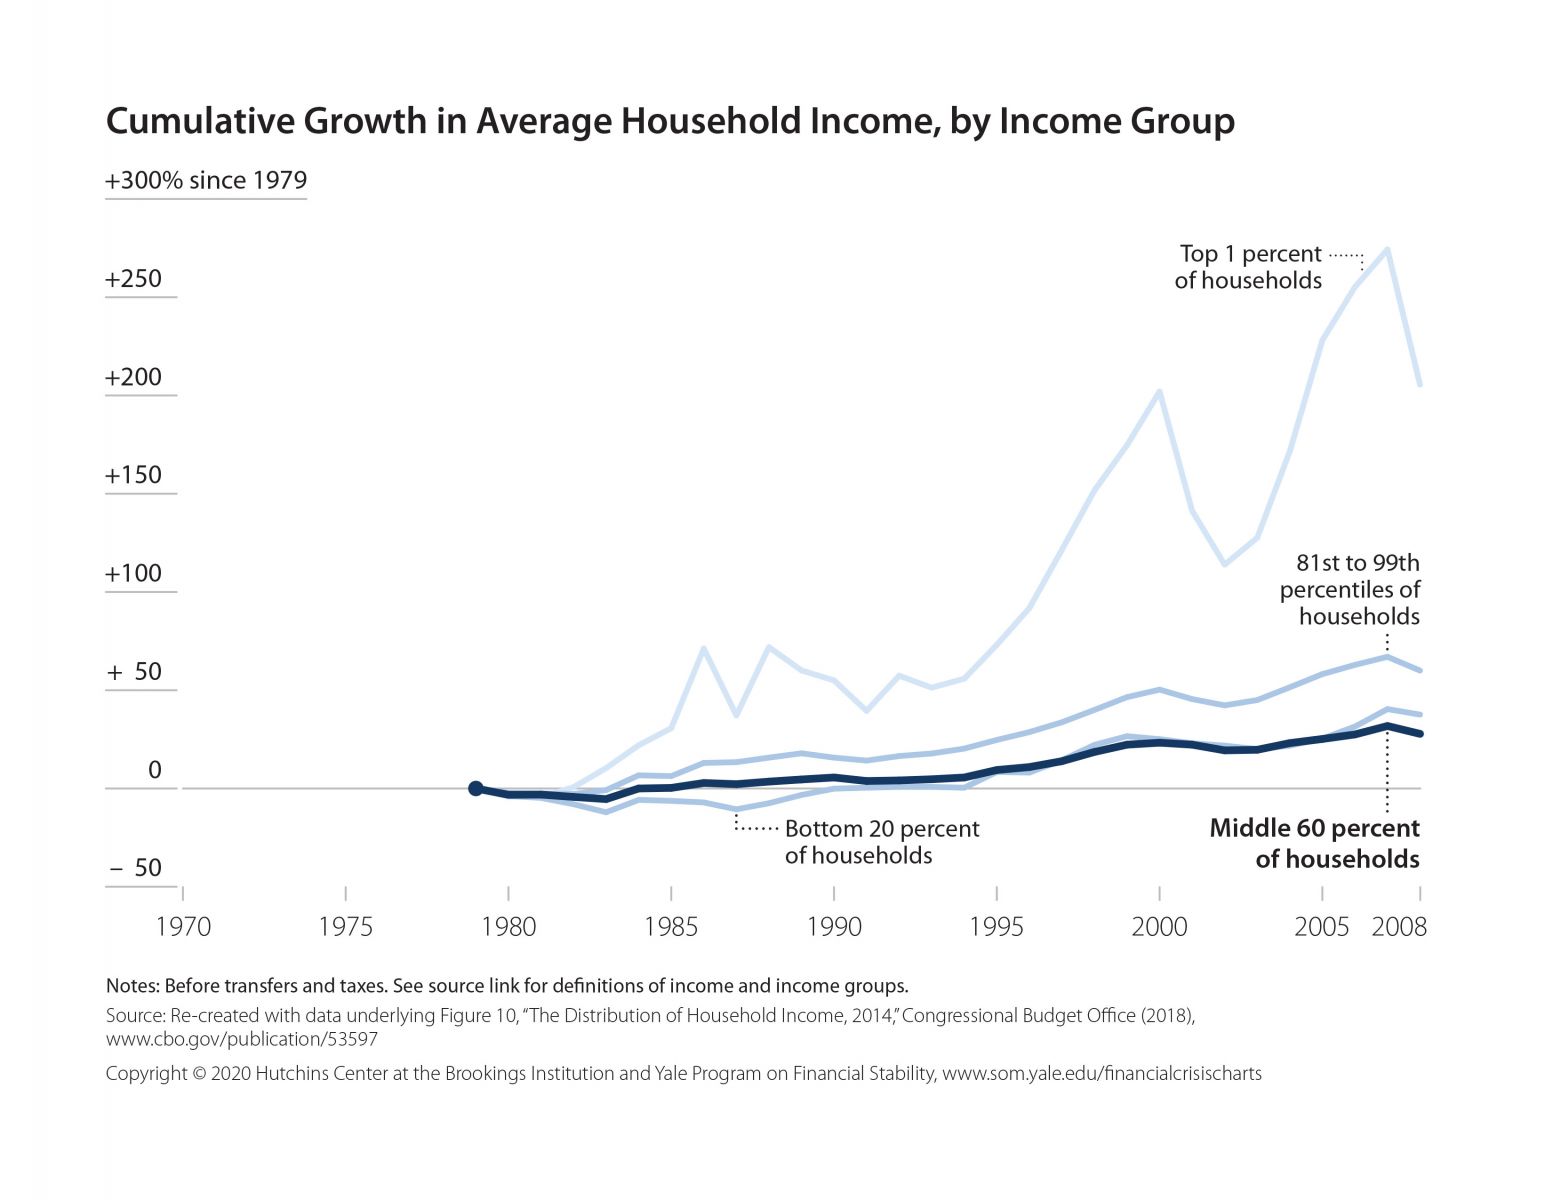
Cumulative Growth in Average Household Income, by Income Group, 1979–2008
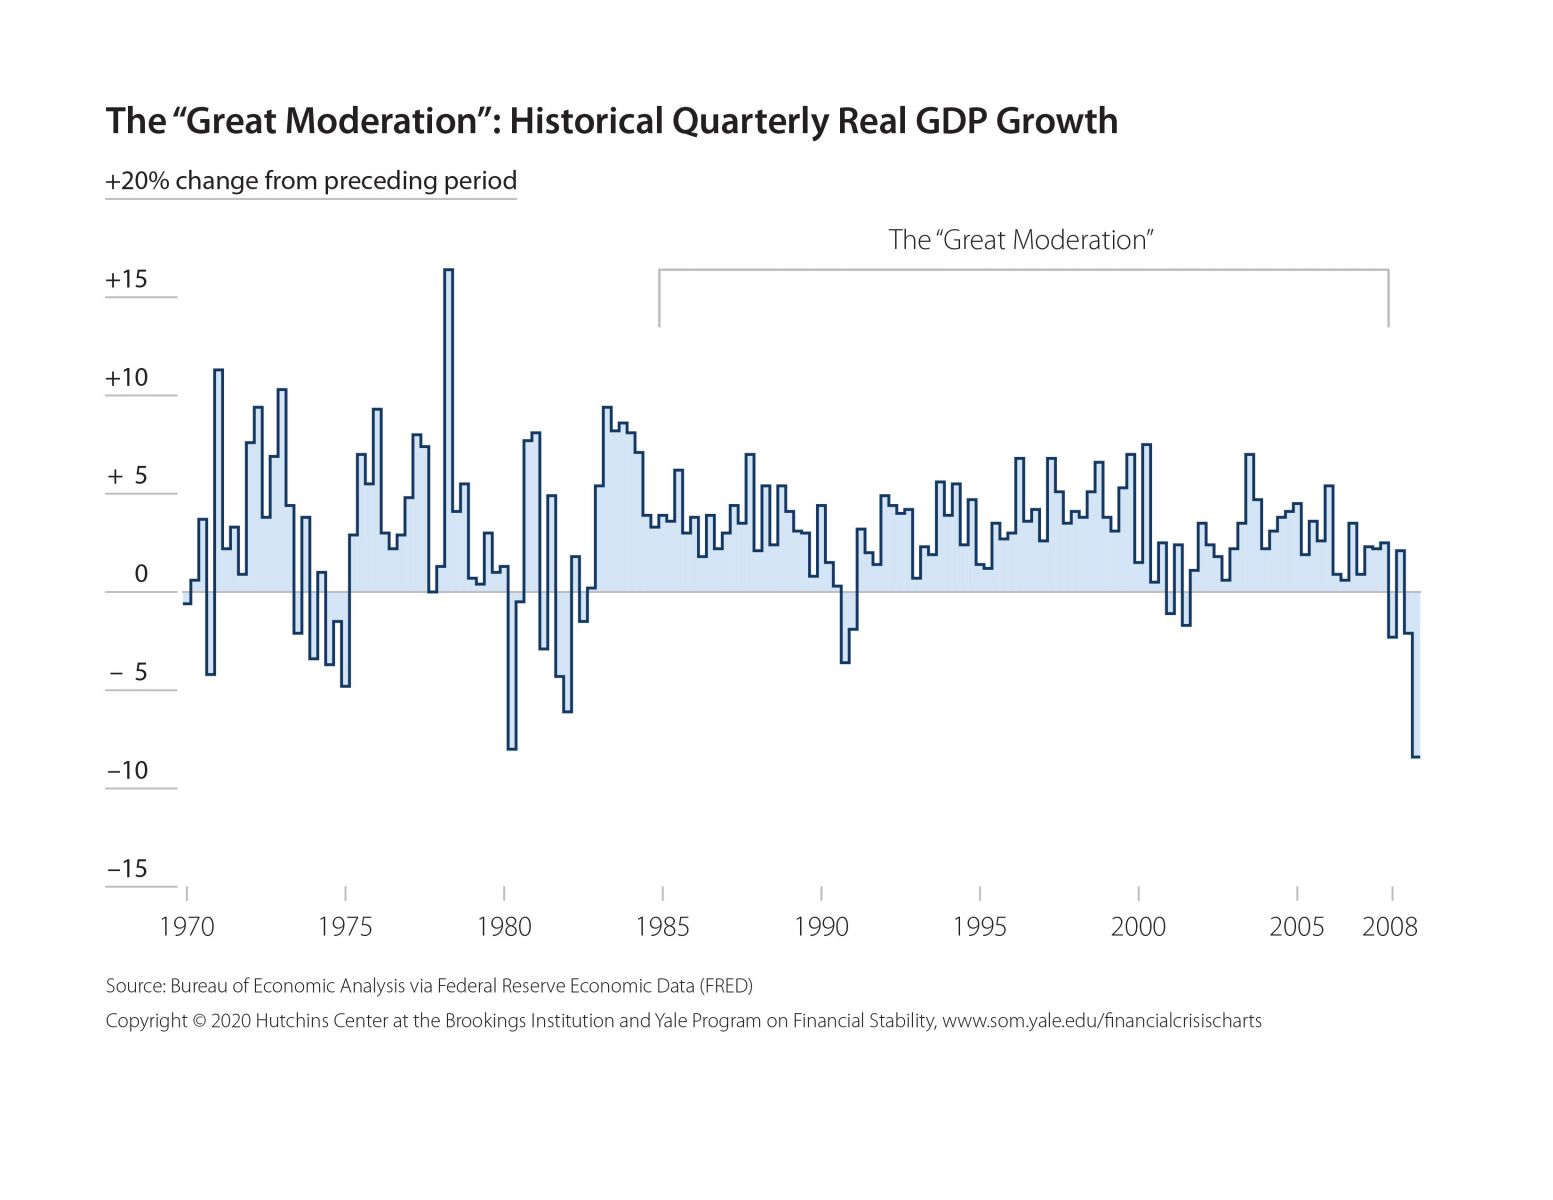
The “Great Moderation”: Quarterly Real GDP Growth, 1970–2008
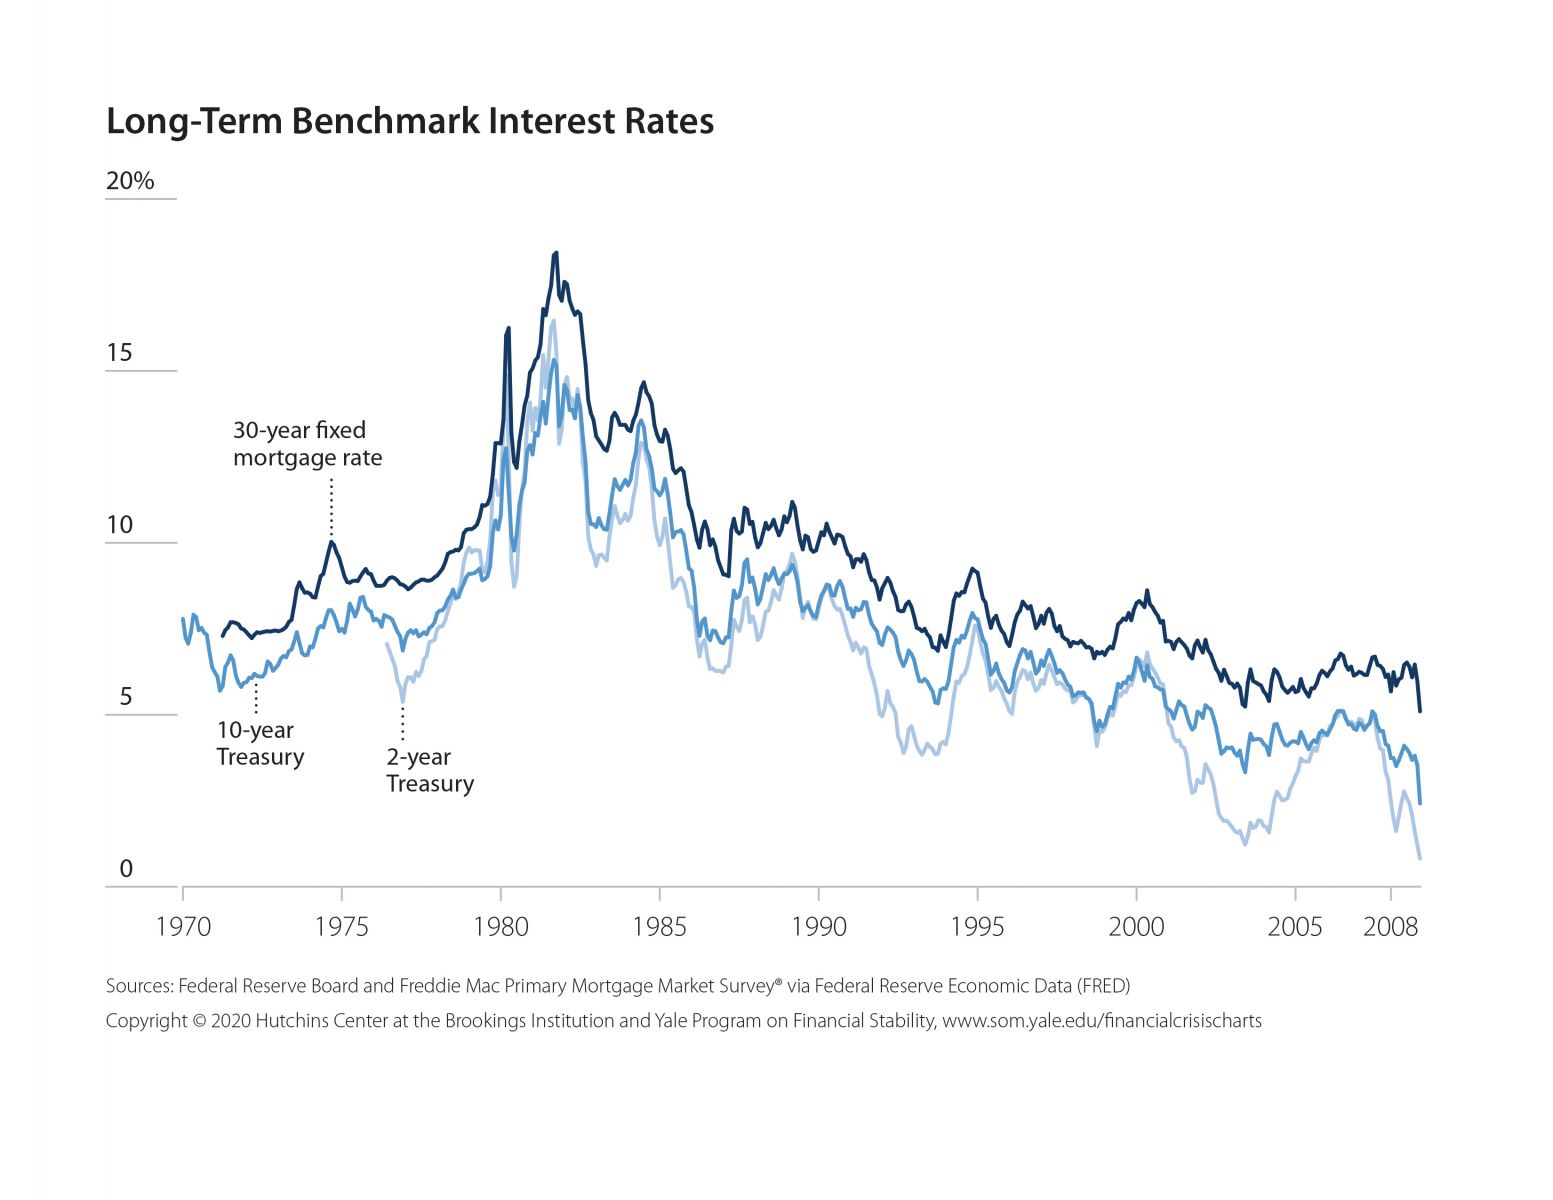
Benchmark Interest Rates, 1970–2008
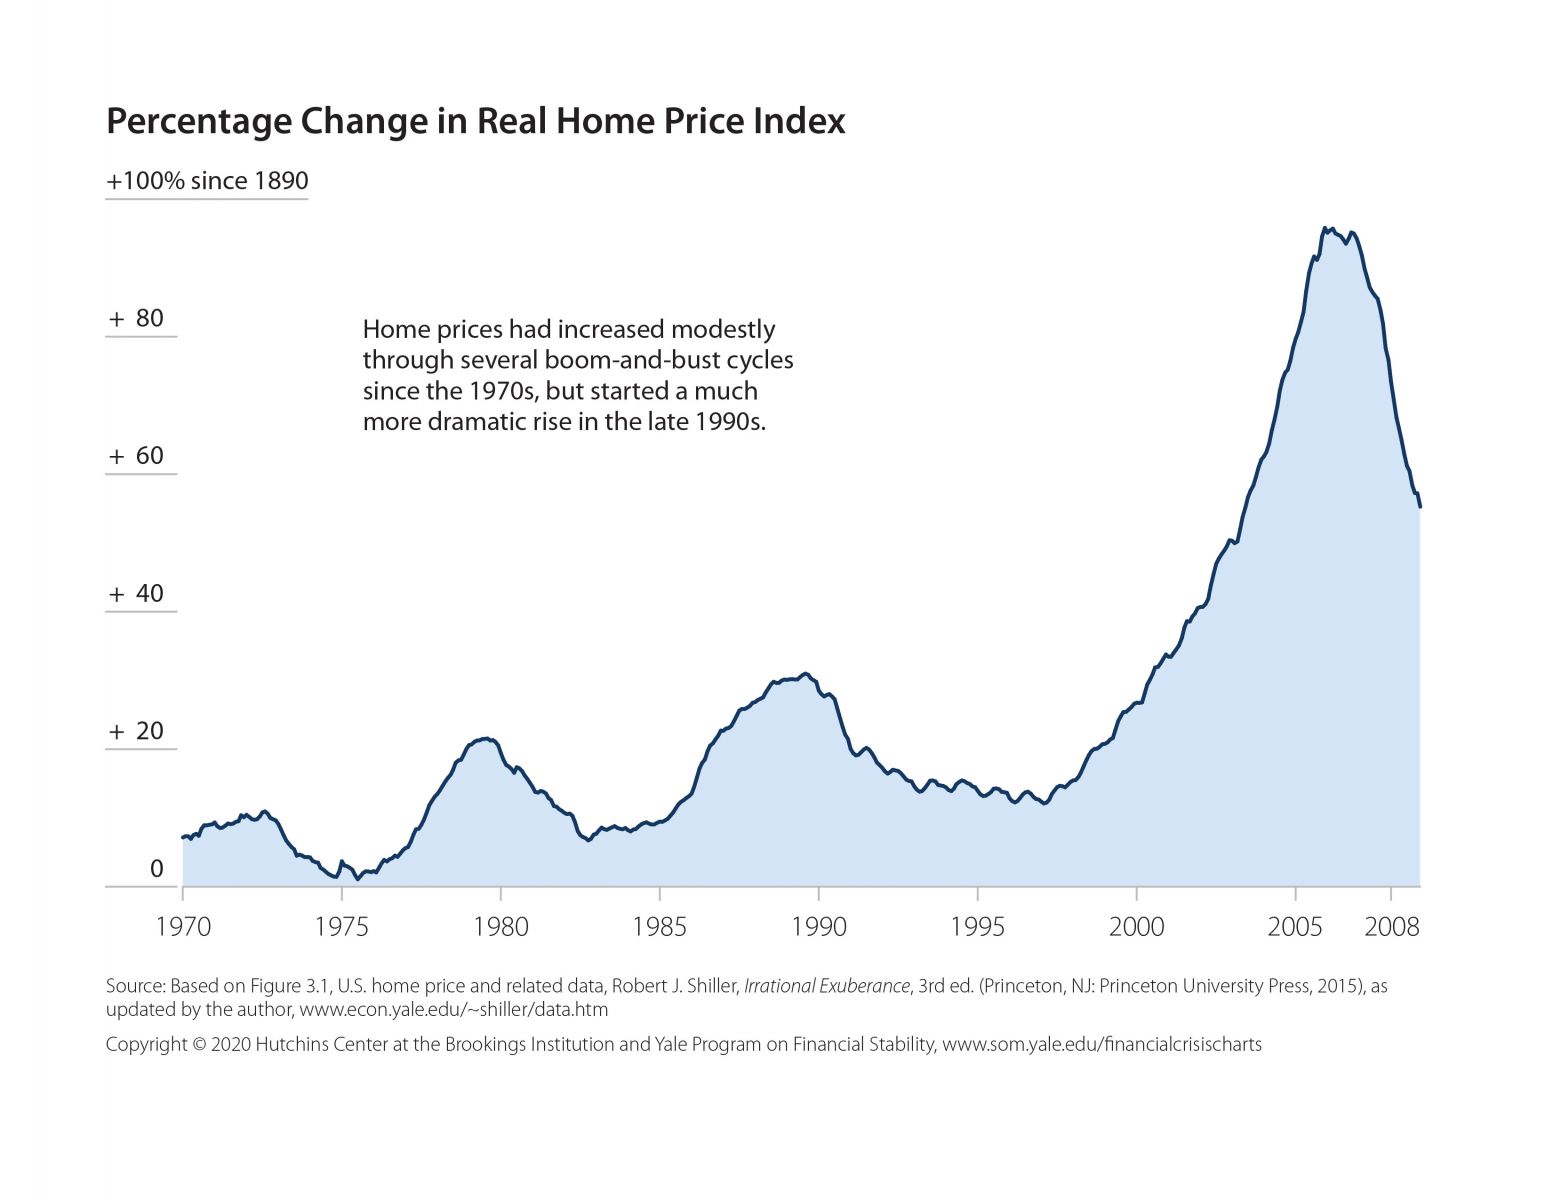
Percentage Change in Real Home Price Index since 1890, 1970–2008
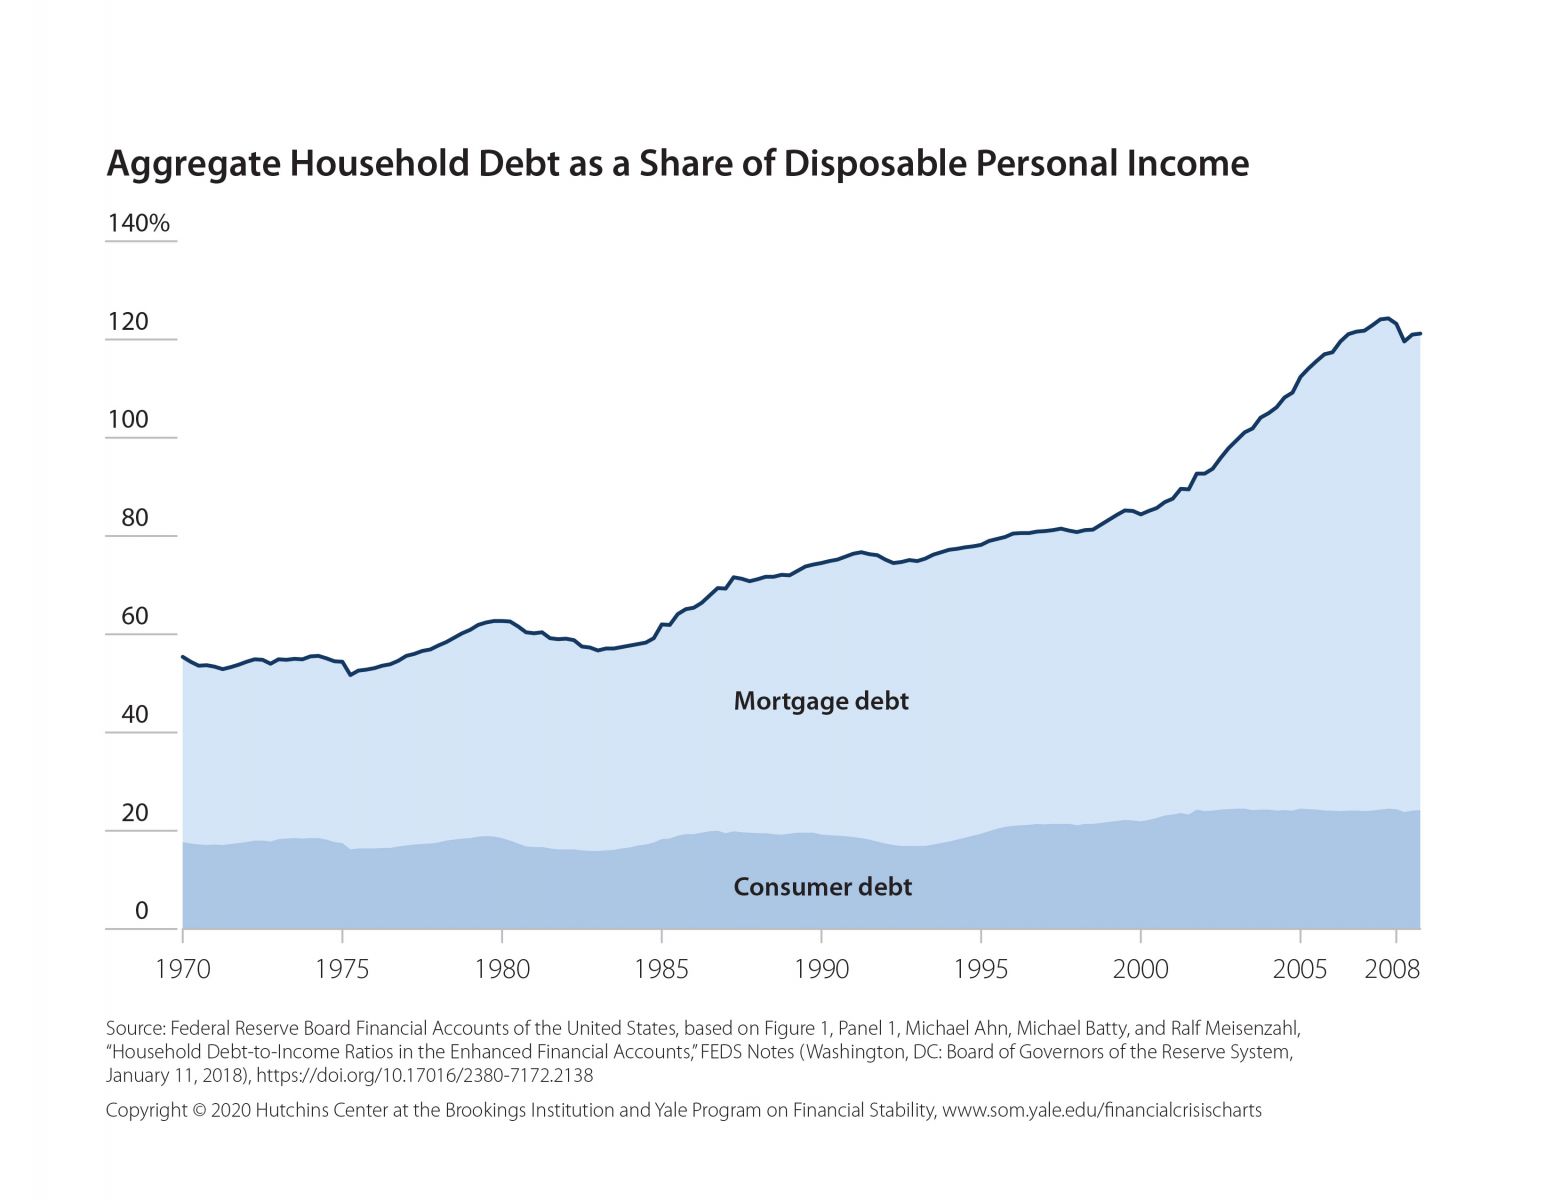
Aggregate Household Debt as a Share of Disposable Personal Income, 1970–2008
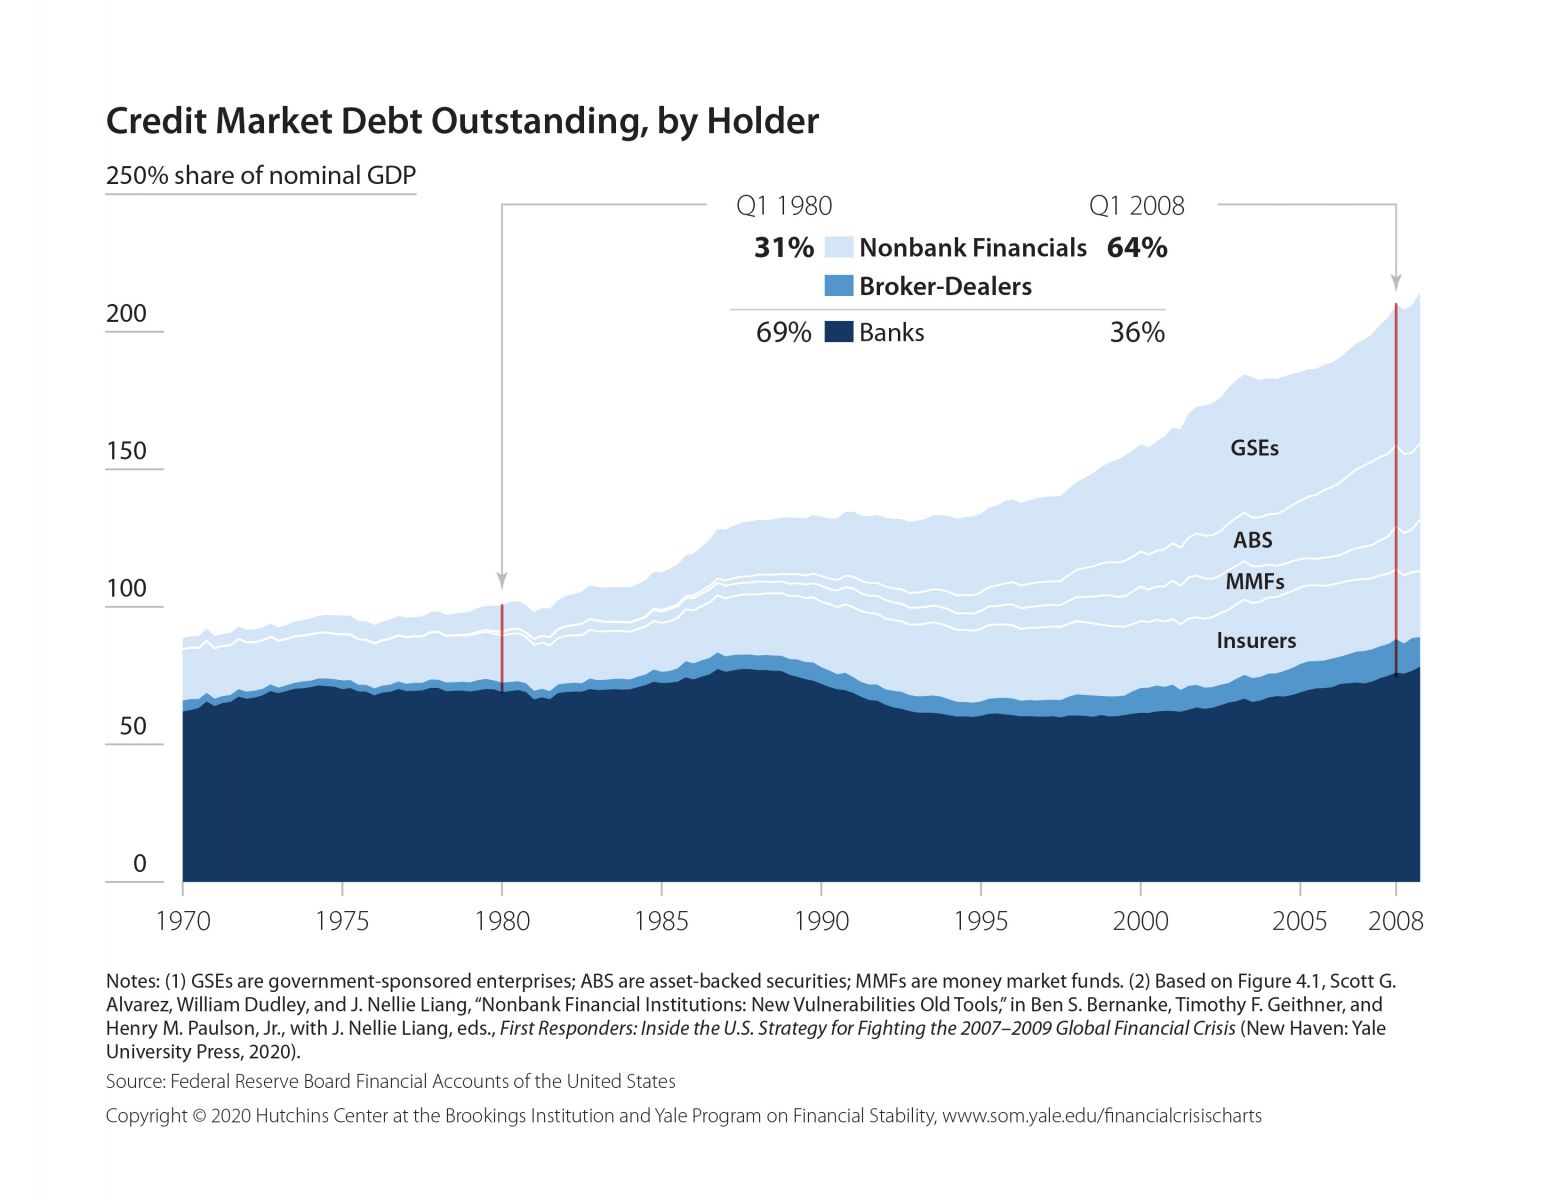
Credit Market Debt Outstanding, by Holder, 1970–2008
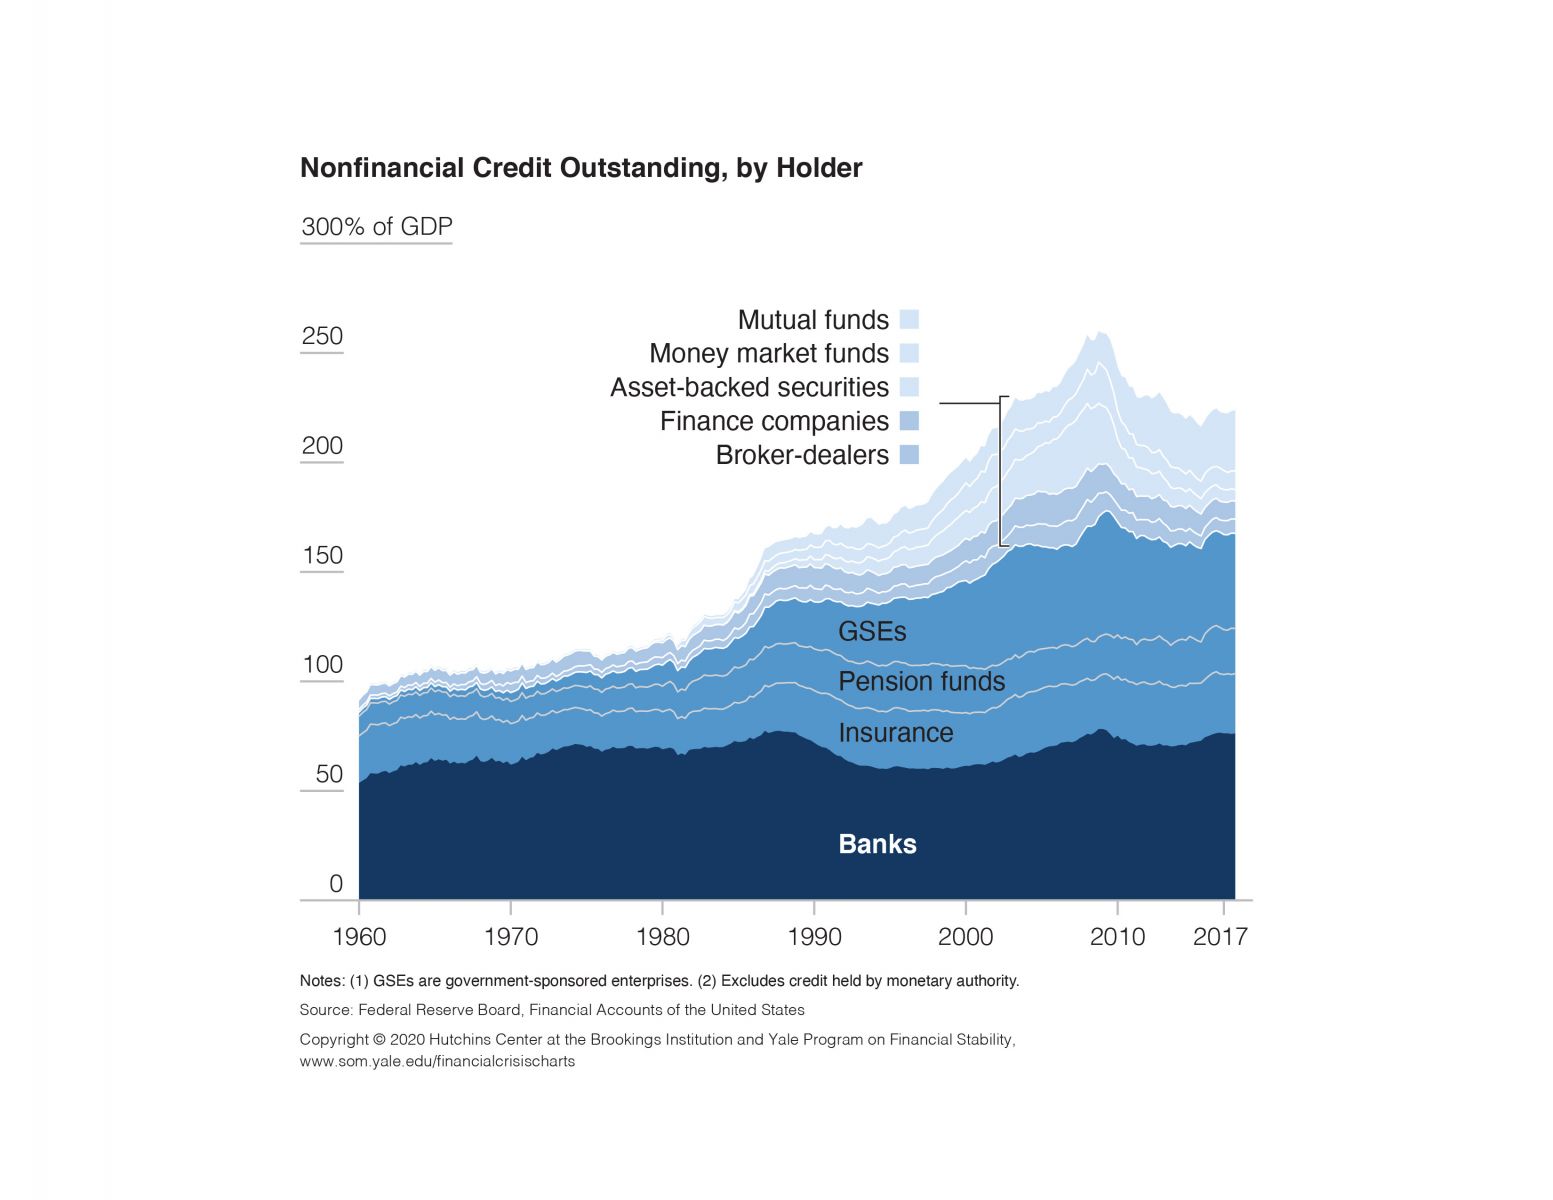
Nonfinancial Credit Outstanding, by Holder, 1960–2017
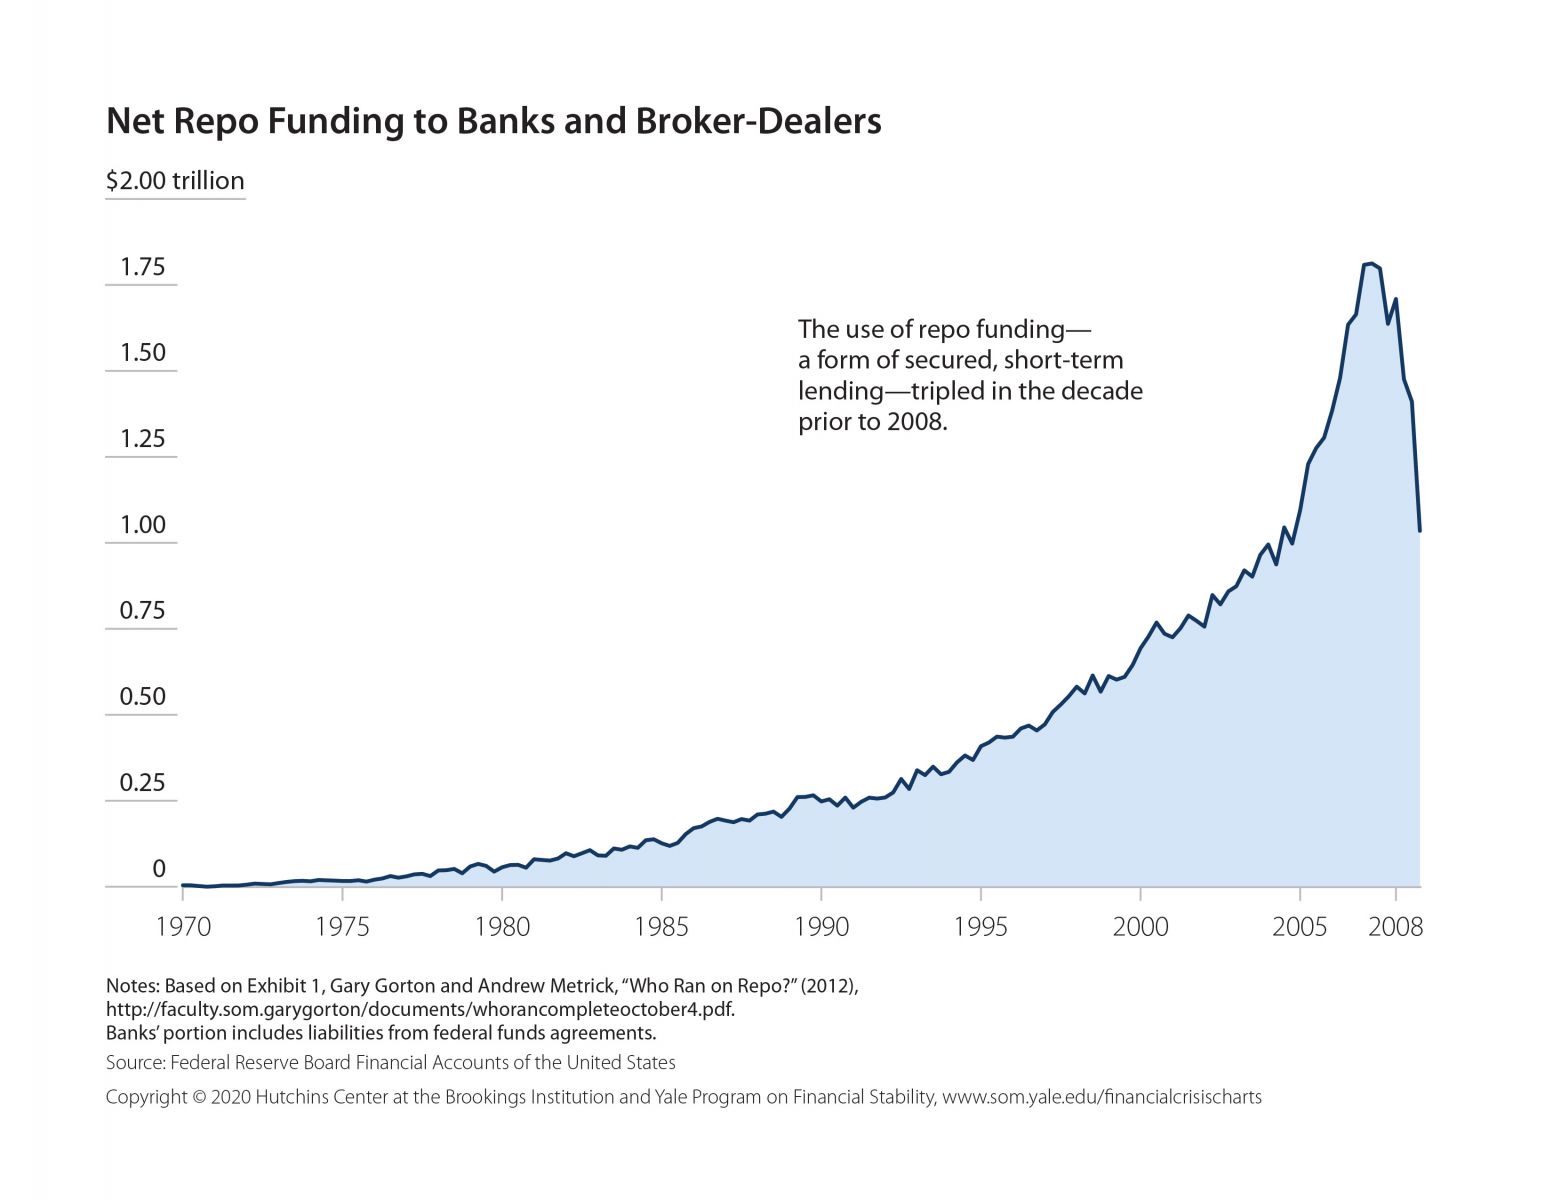
Net Repo Funding to Banks and Broker-Dealers, 1970–2008
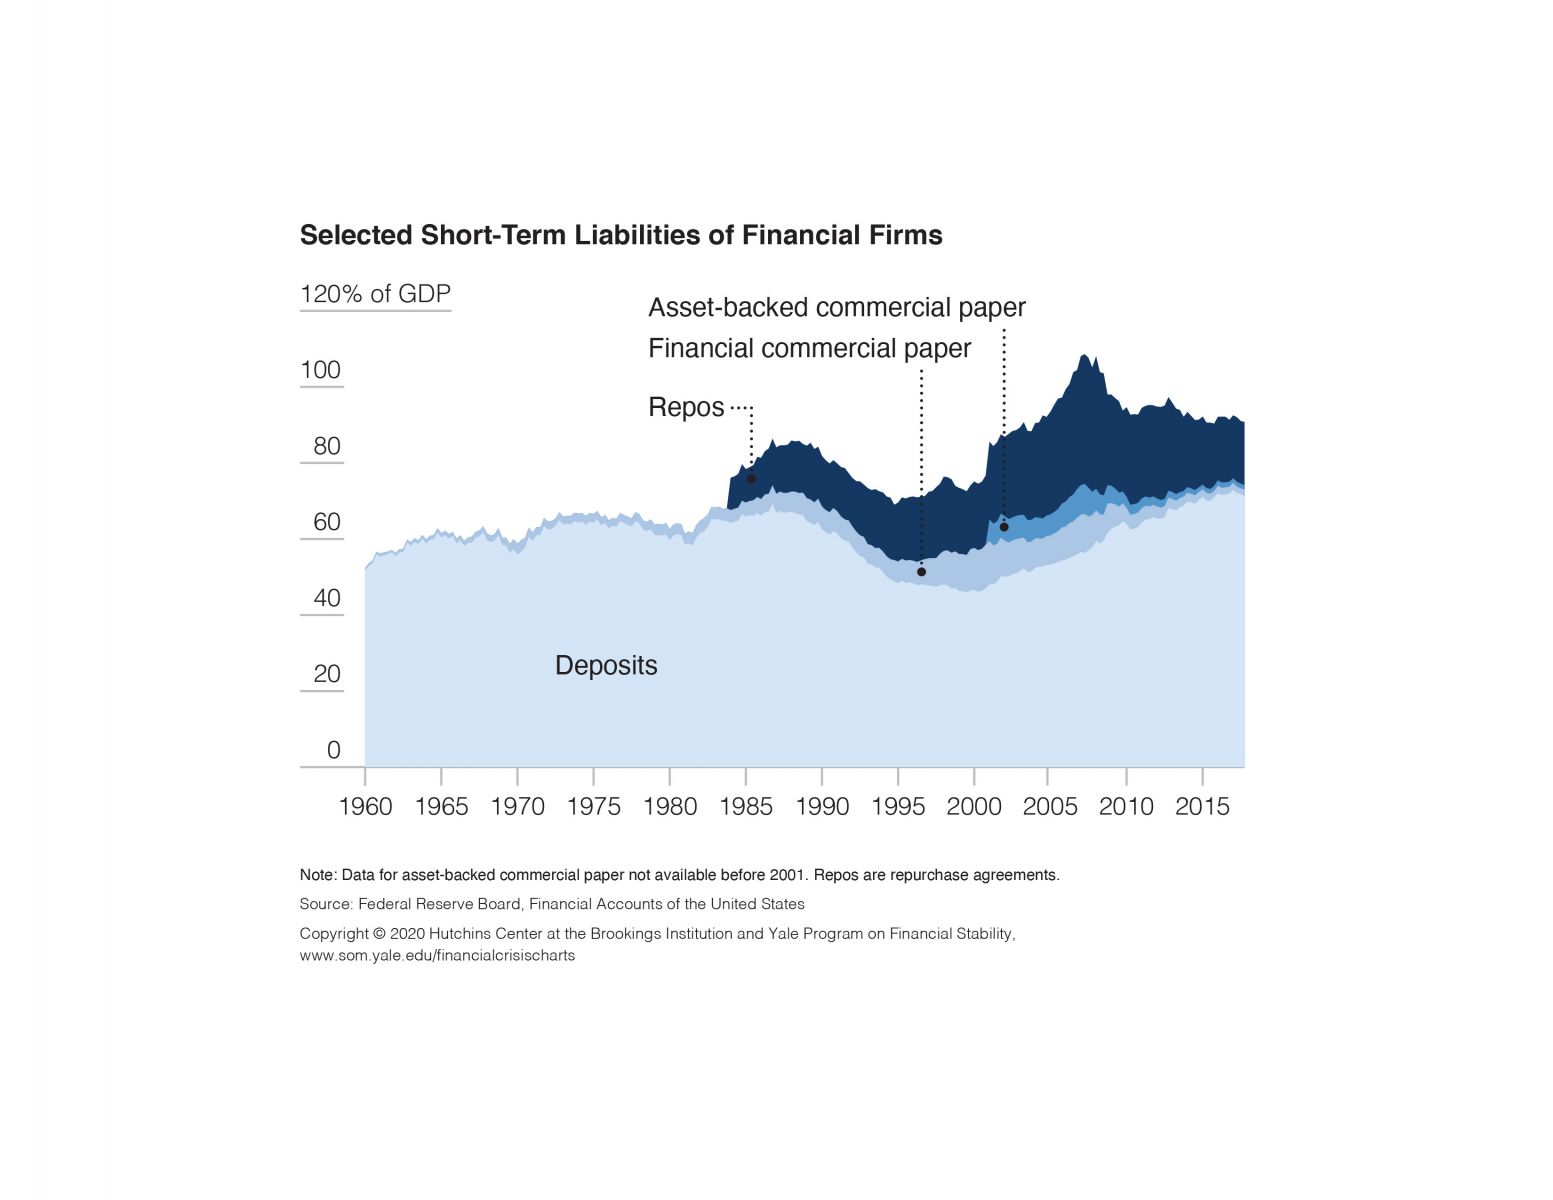
Selected Short-Term Liabilities of Financial Firms, 1960–2017
Overviews
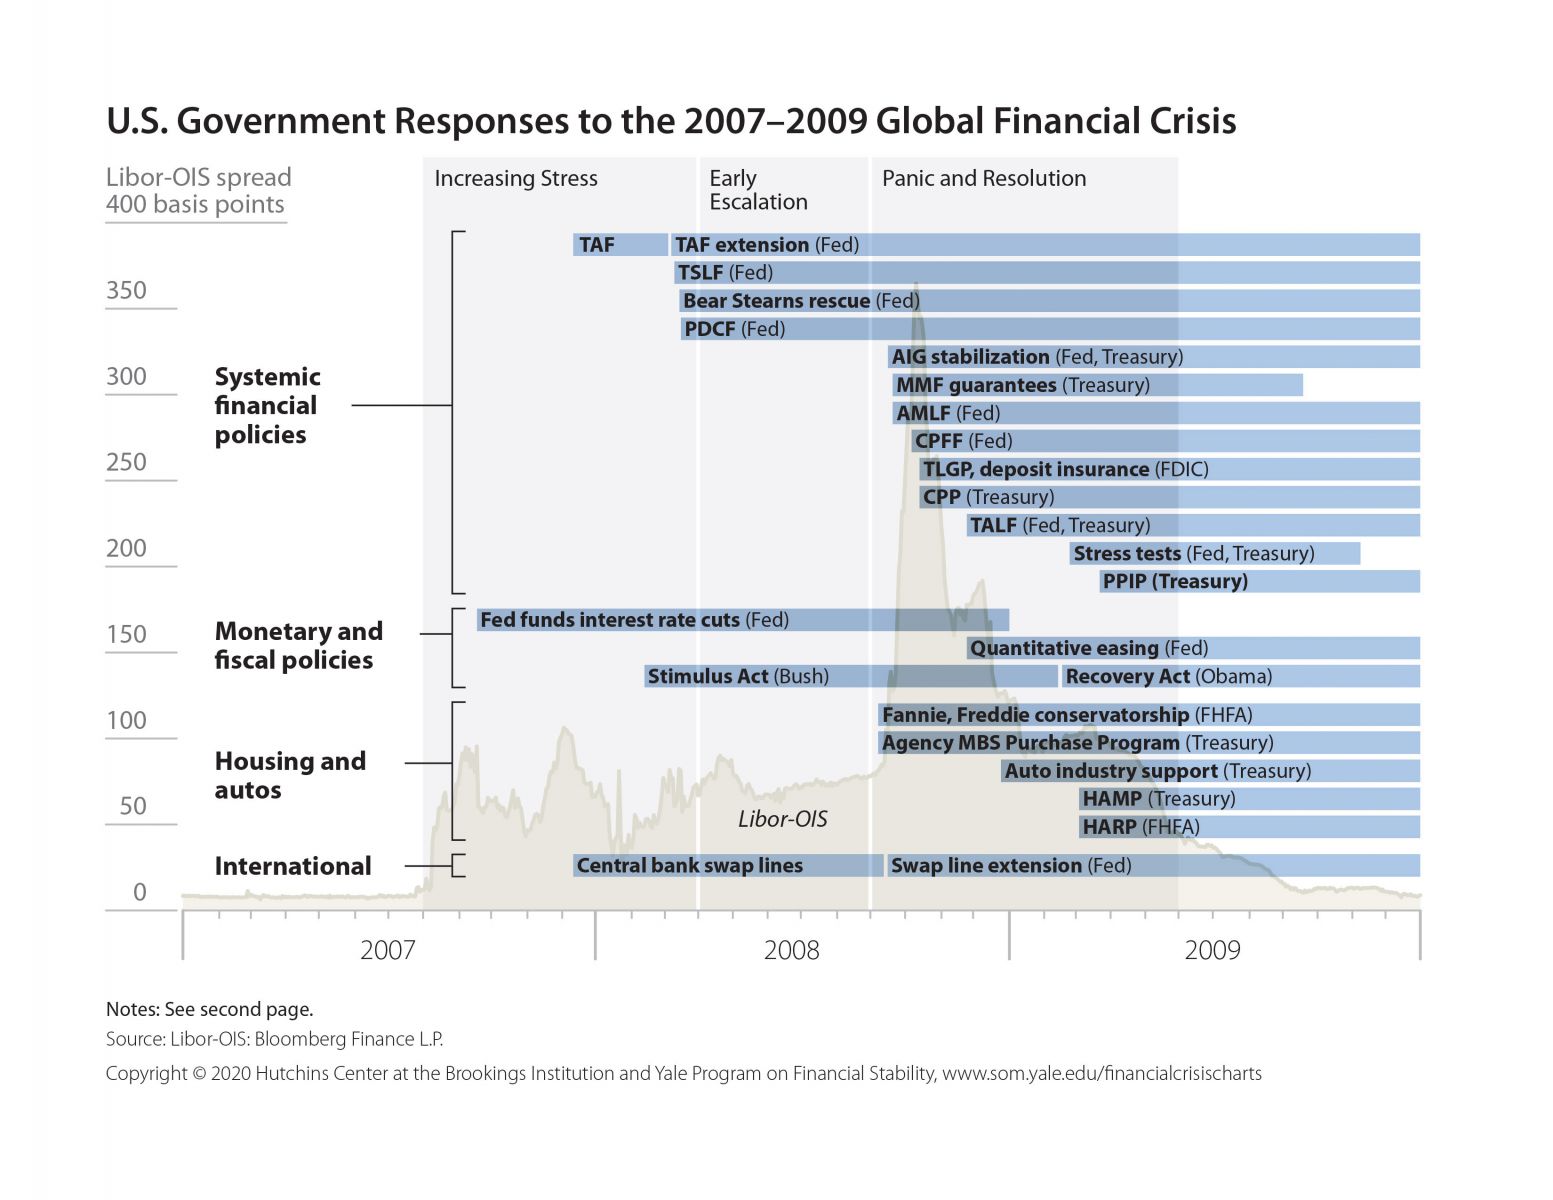
U.S. Government Responses to the 2007–2009 Global Financial Crisis
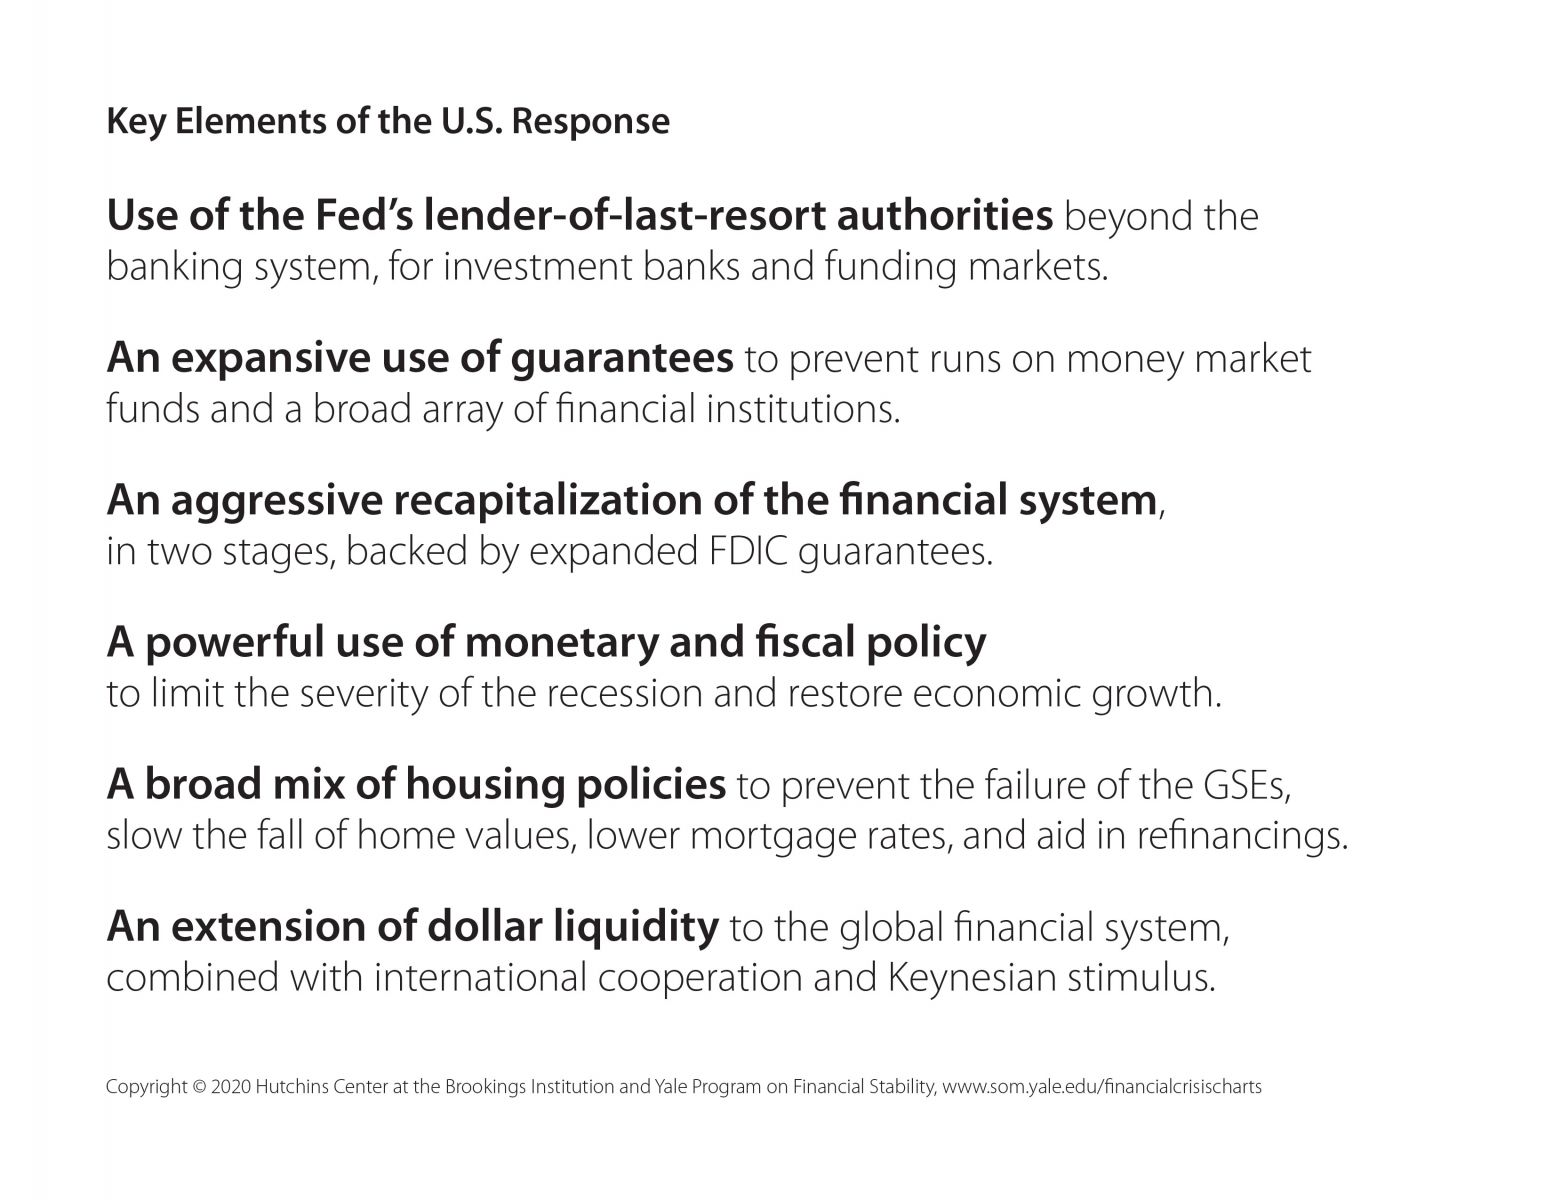
Key Elements of the U.S. Response
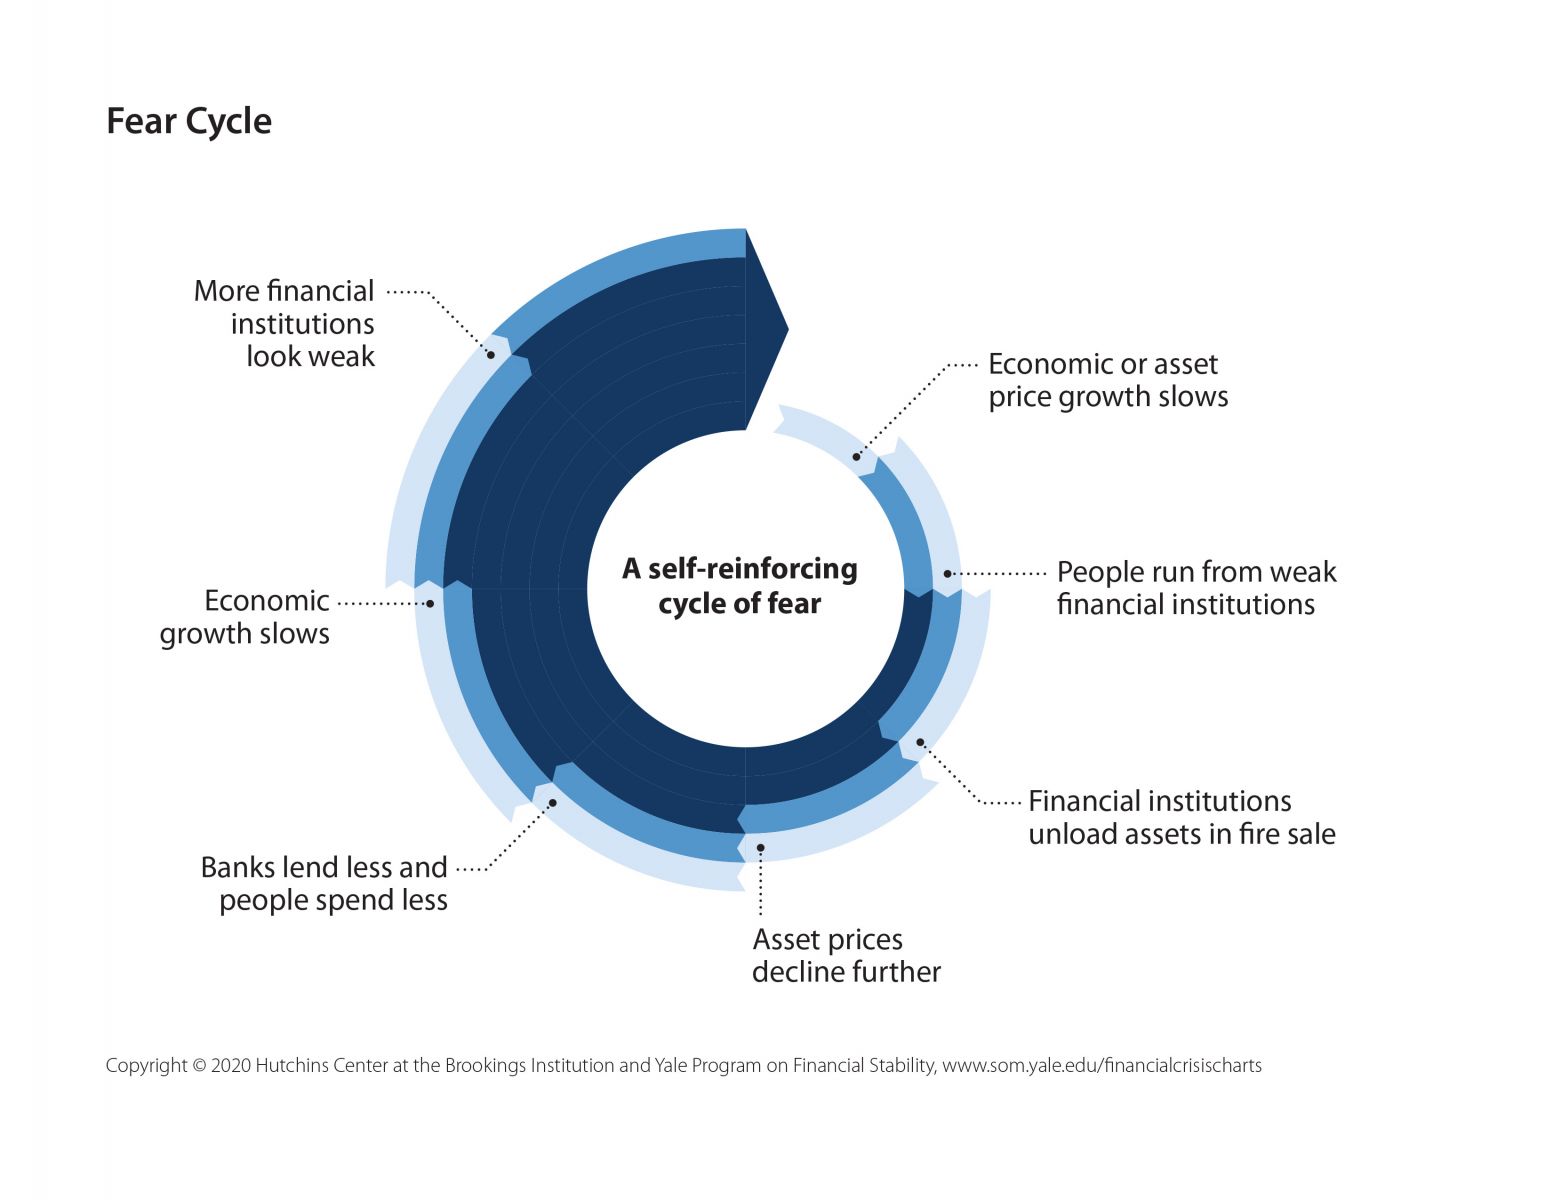
Fear Cycle
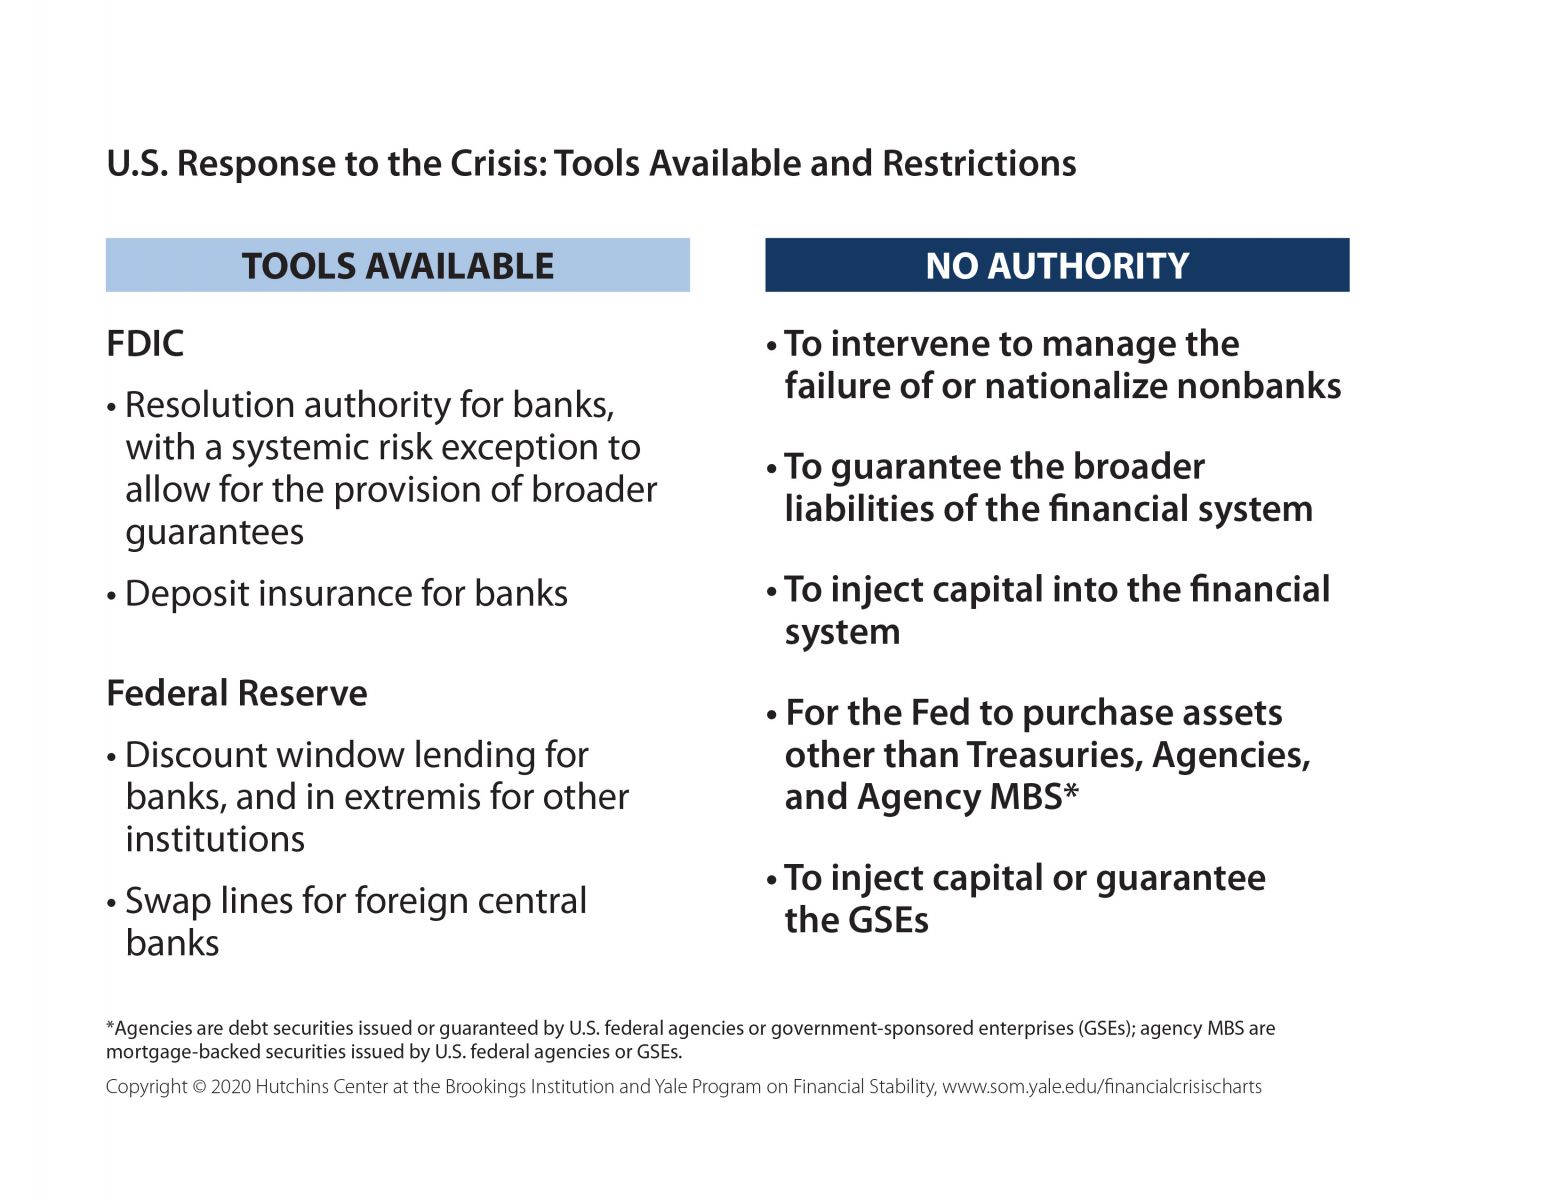
U.S. Response to the Crisis: Tools Available and Restrictions
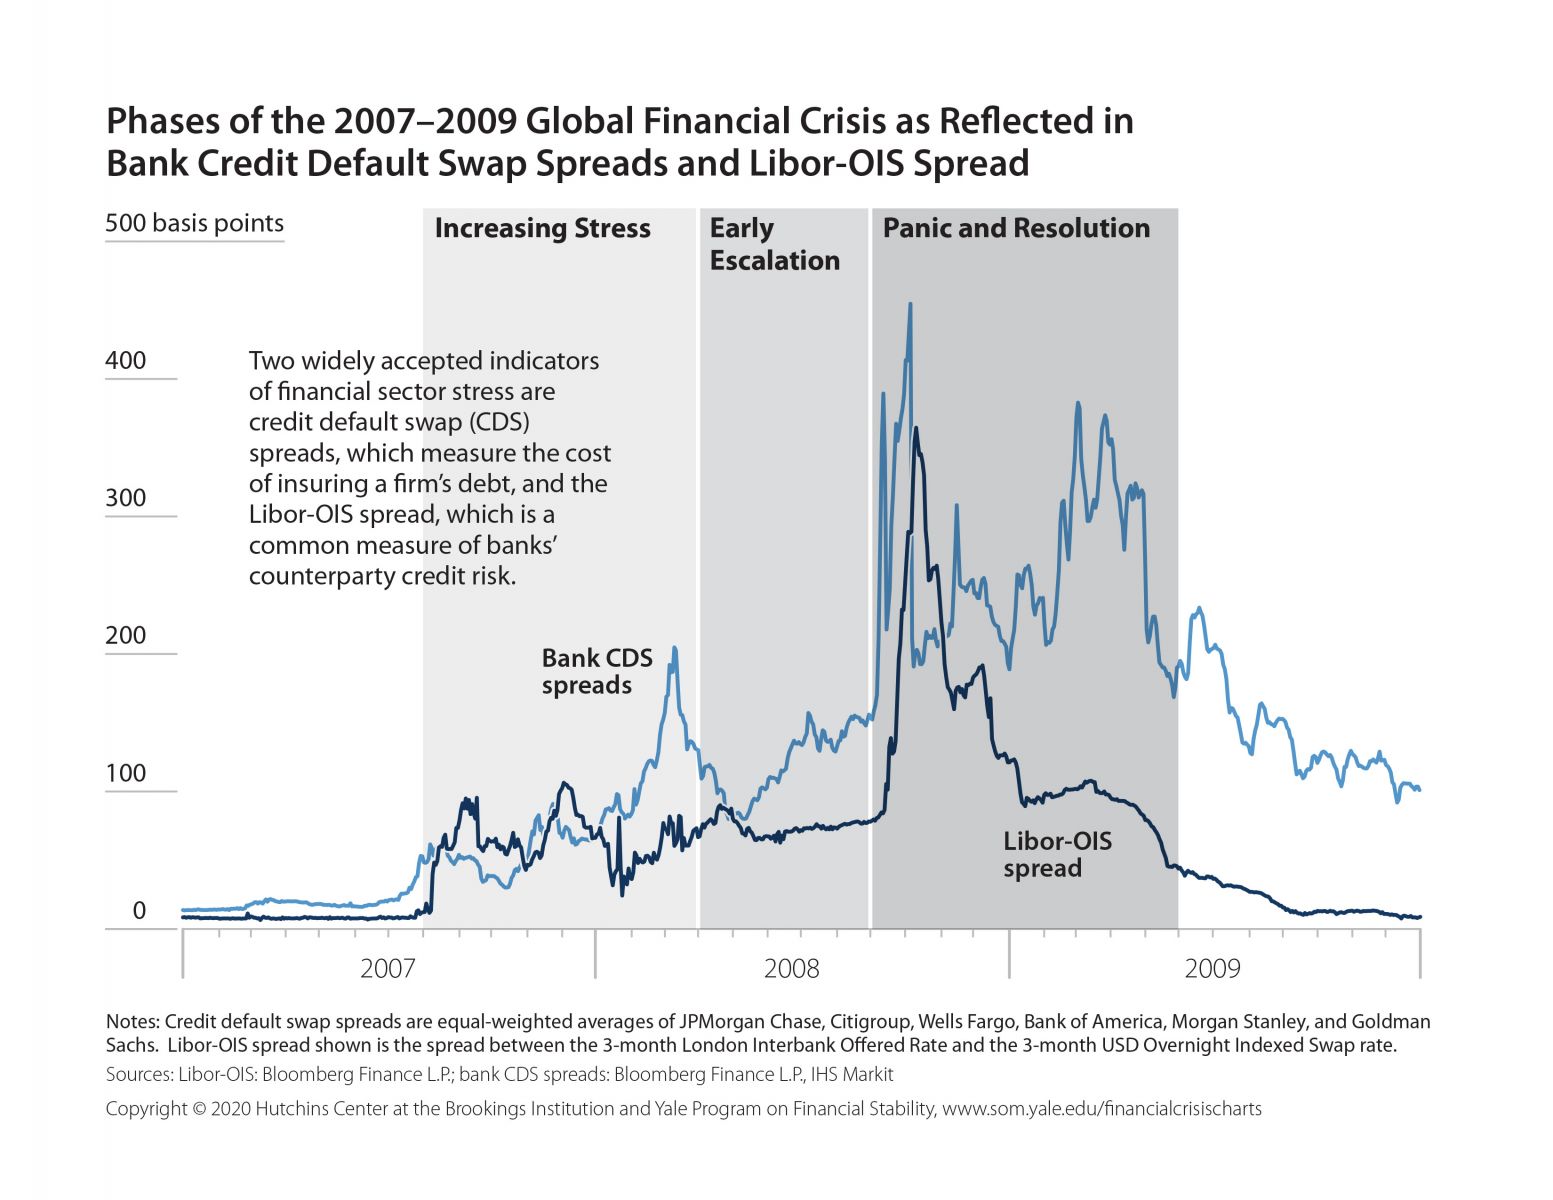
Phases of the 2007–2009 Global Financial Crisis as Reflected in Bank Credit Default Swap Spreads and Libor-OIS Spread
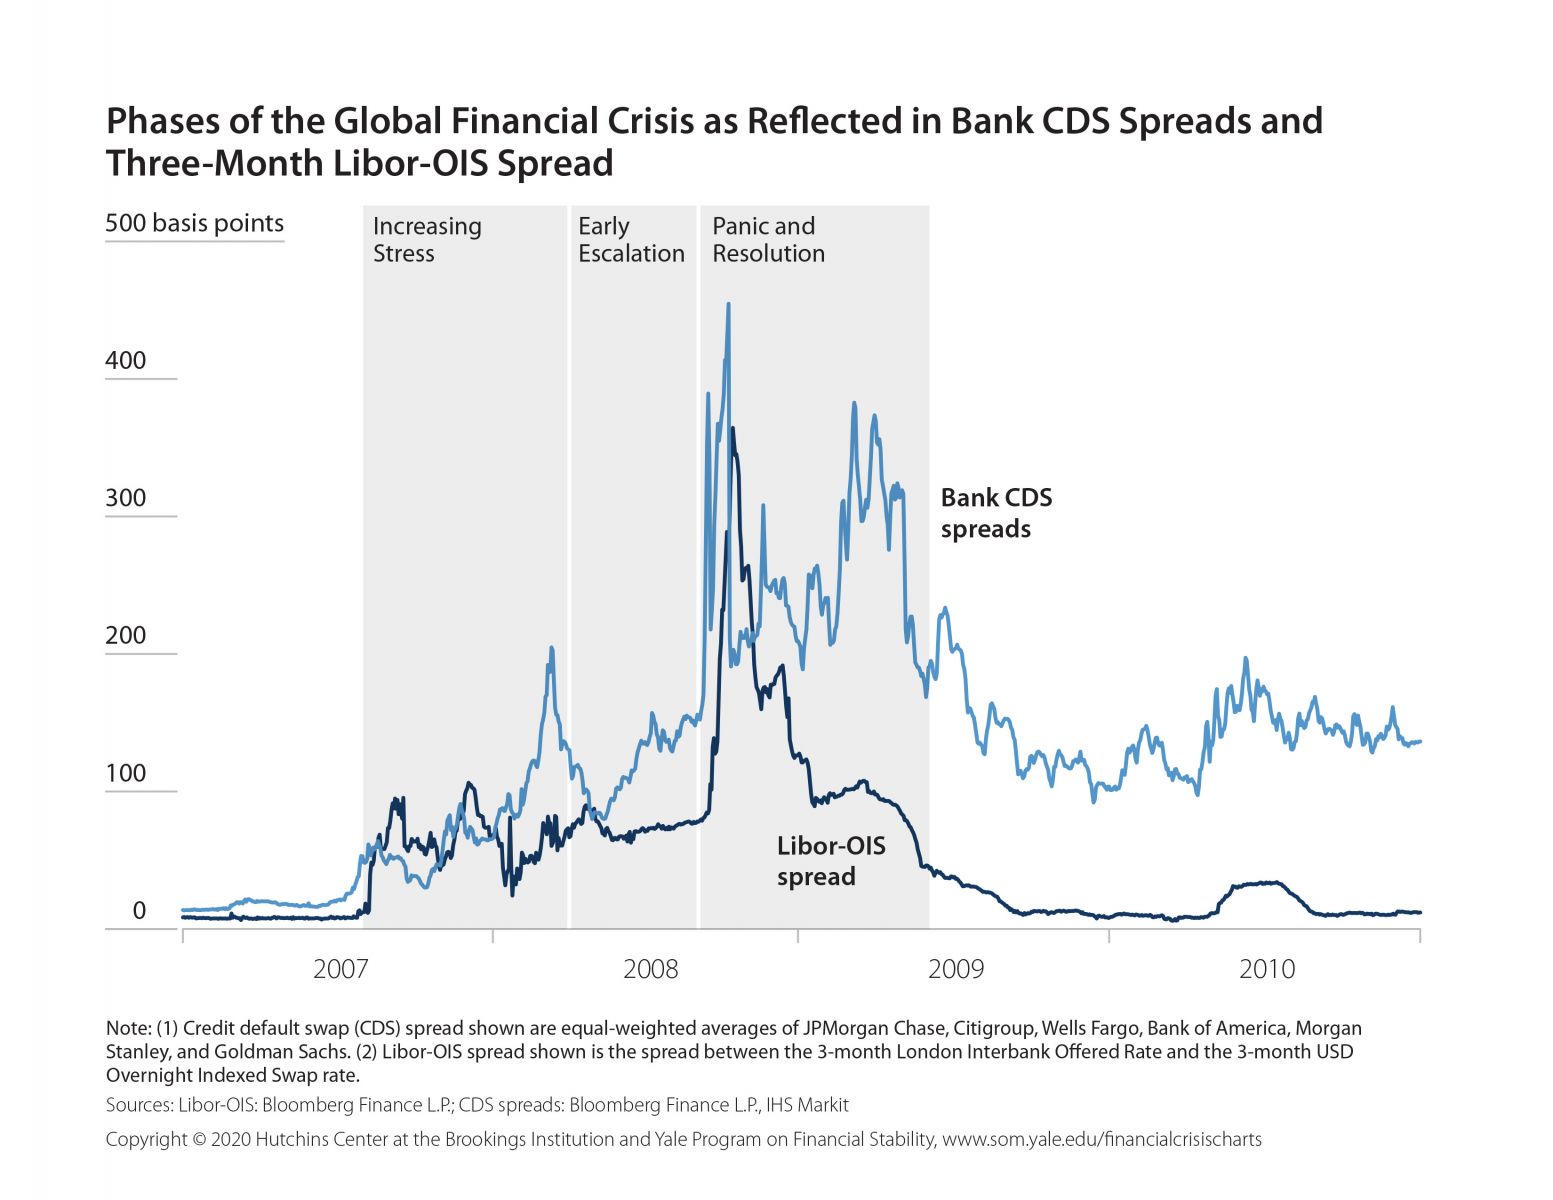
Phases of the Global Financial Crisis as Reflected in Bank CDS Spreads and Three-Month Libor-OIS Spread, 2007–2010
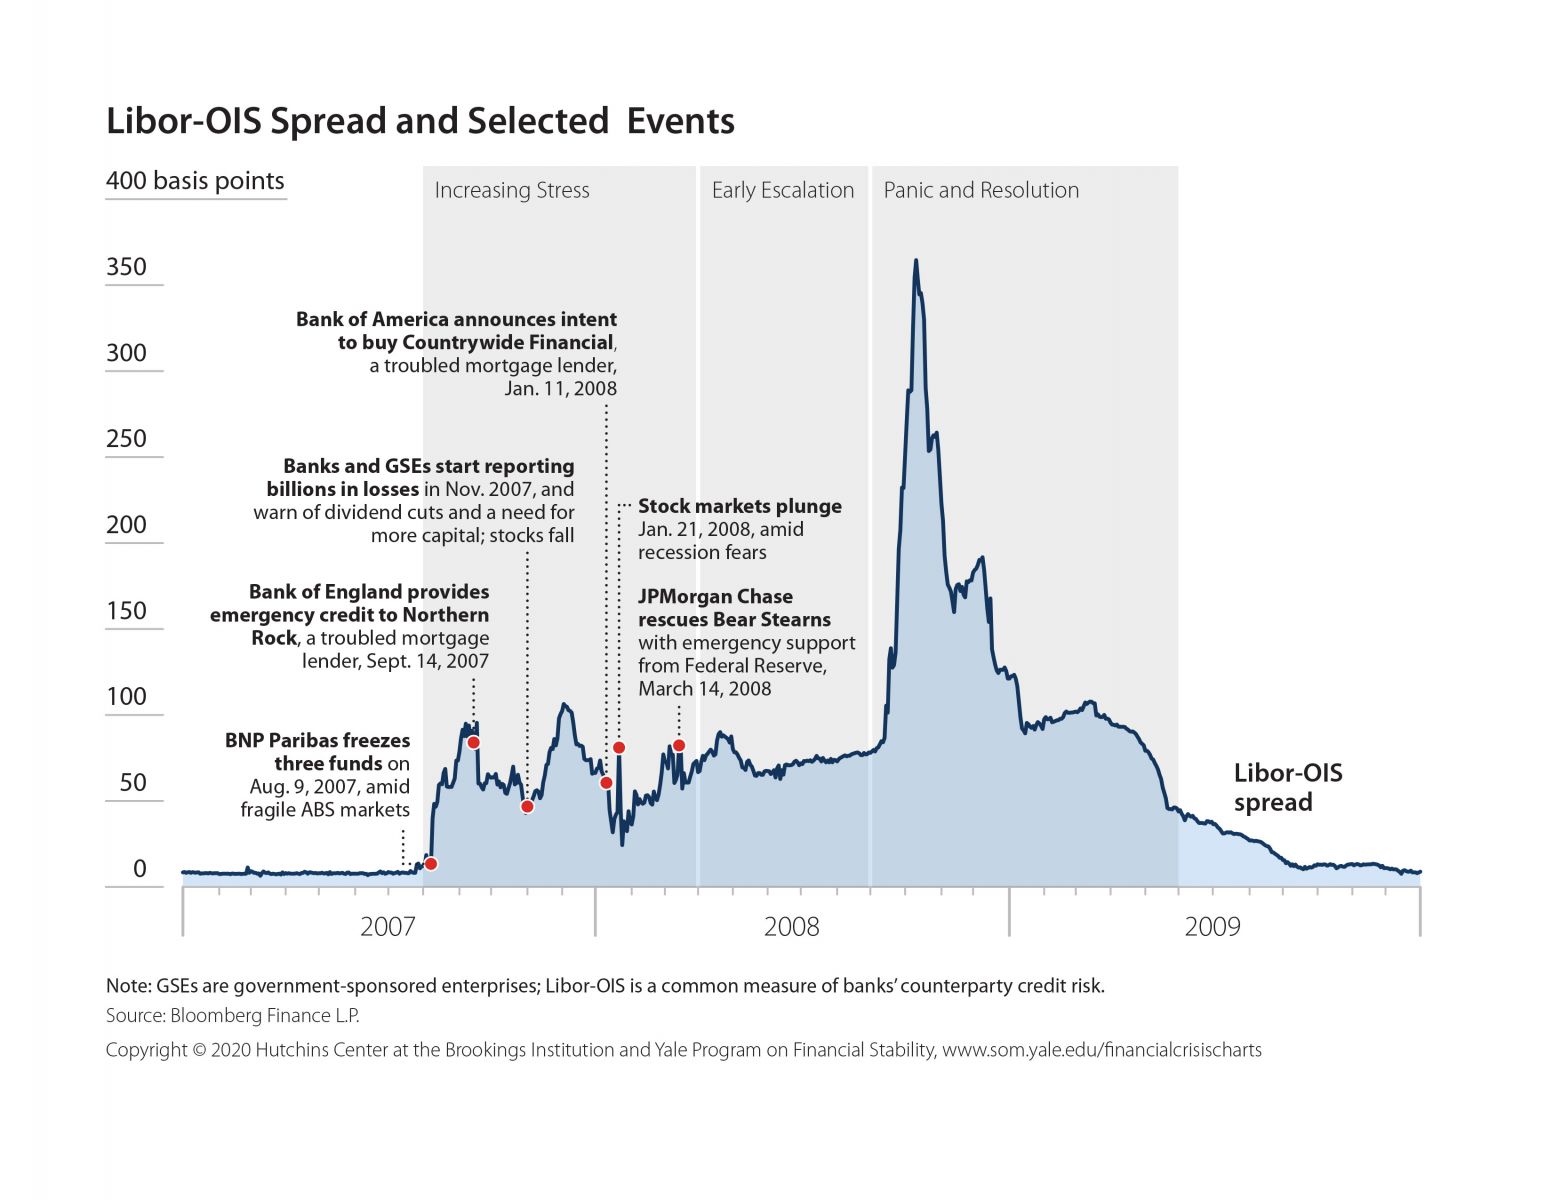
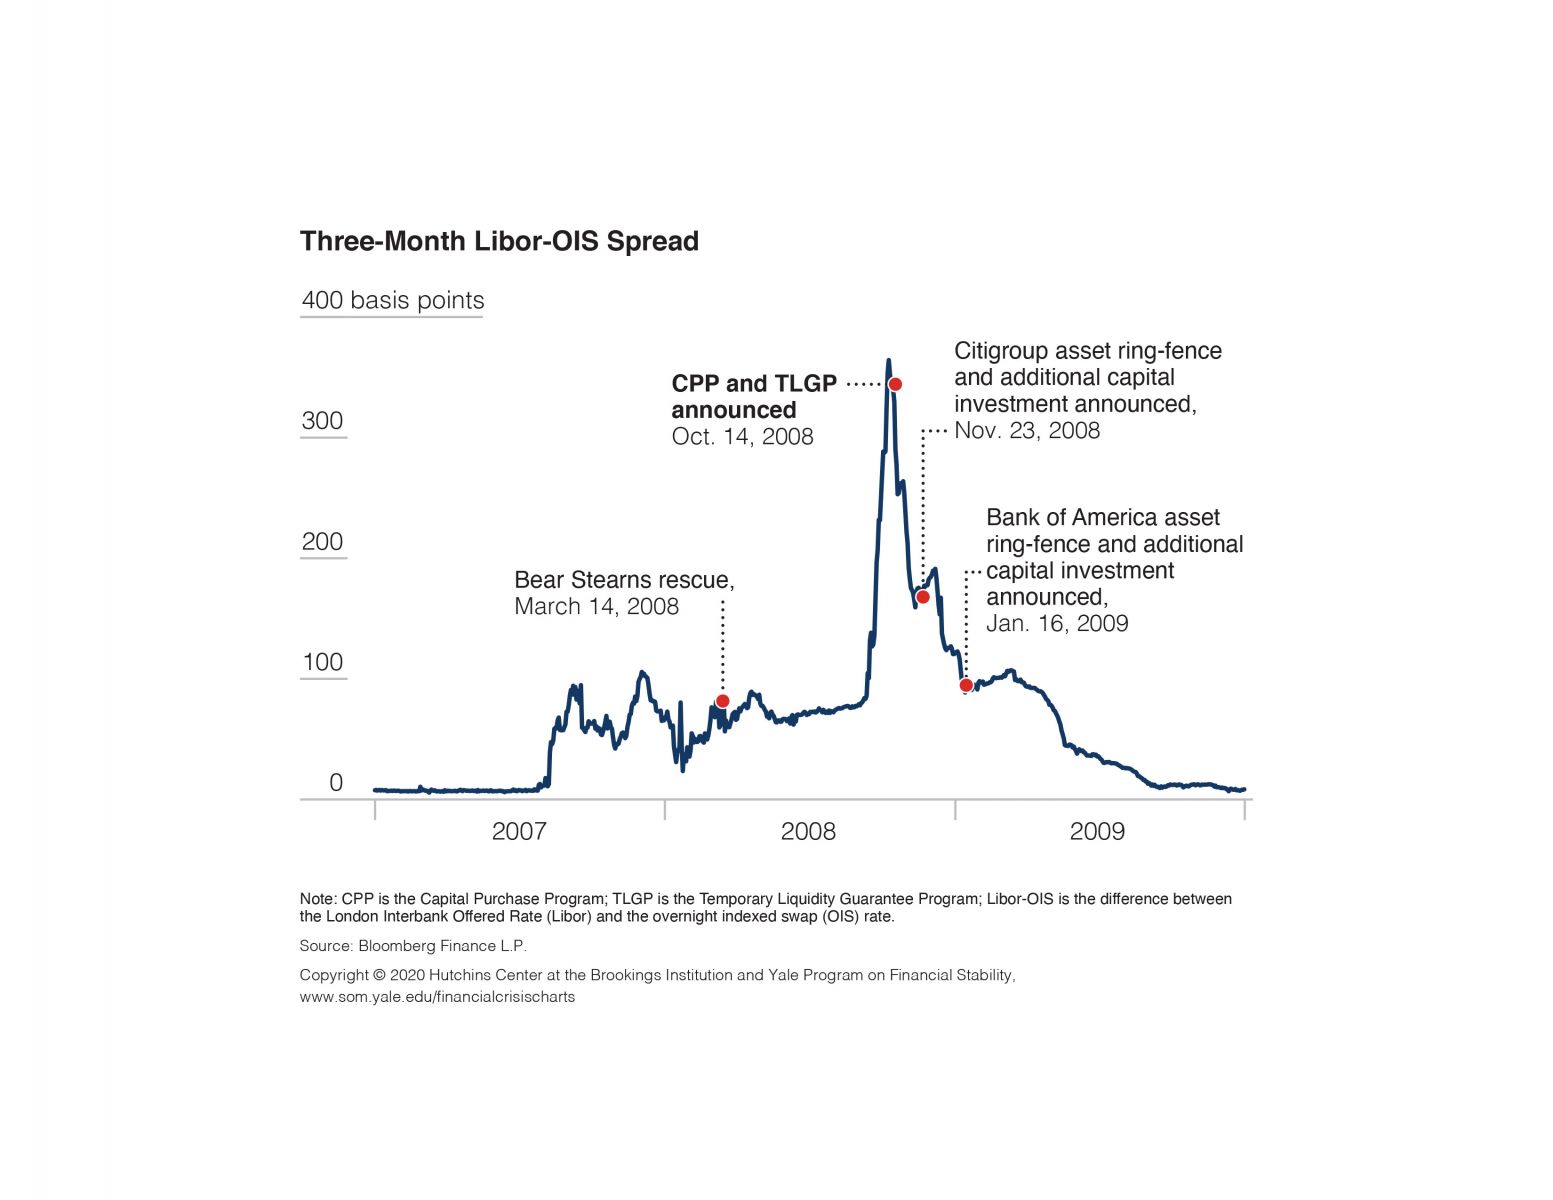
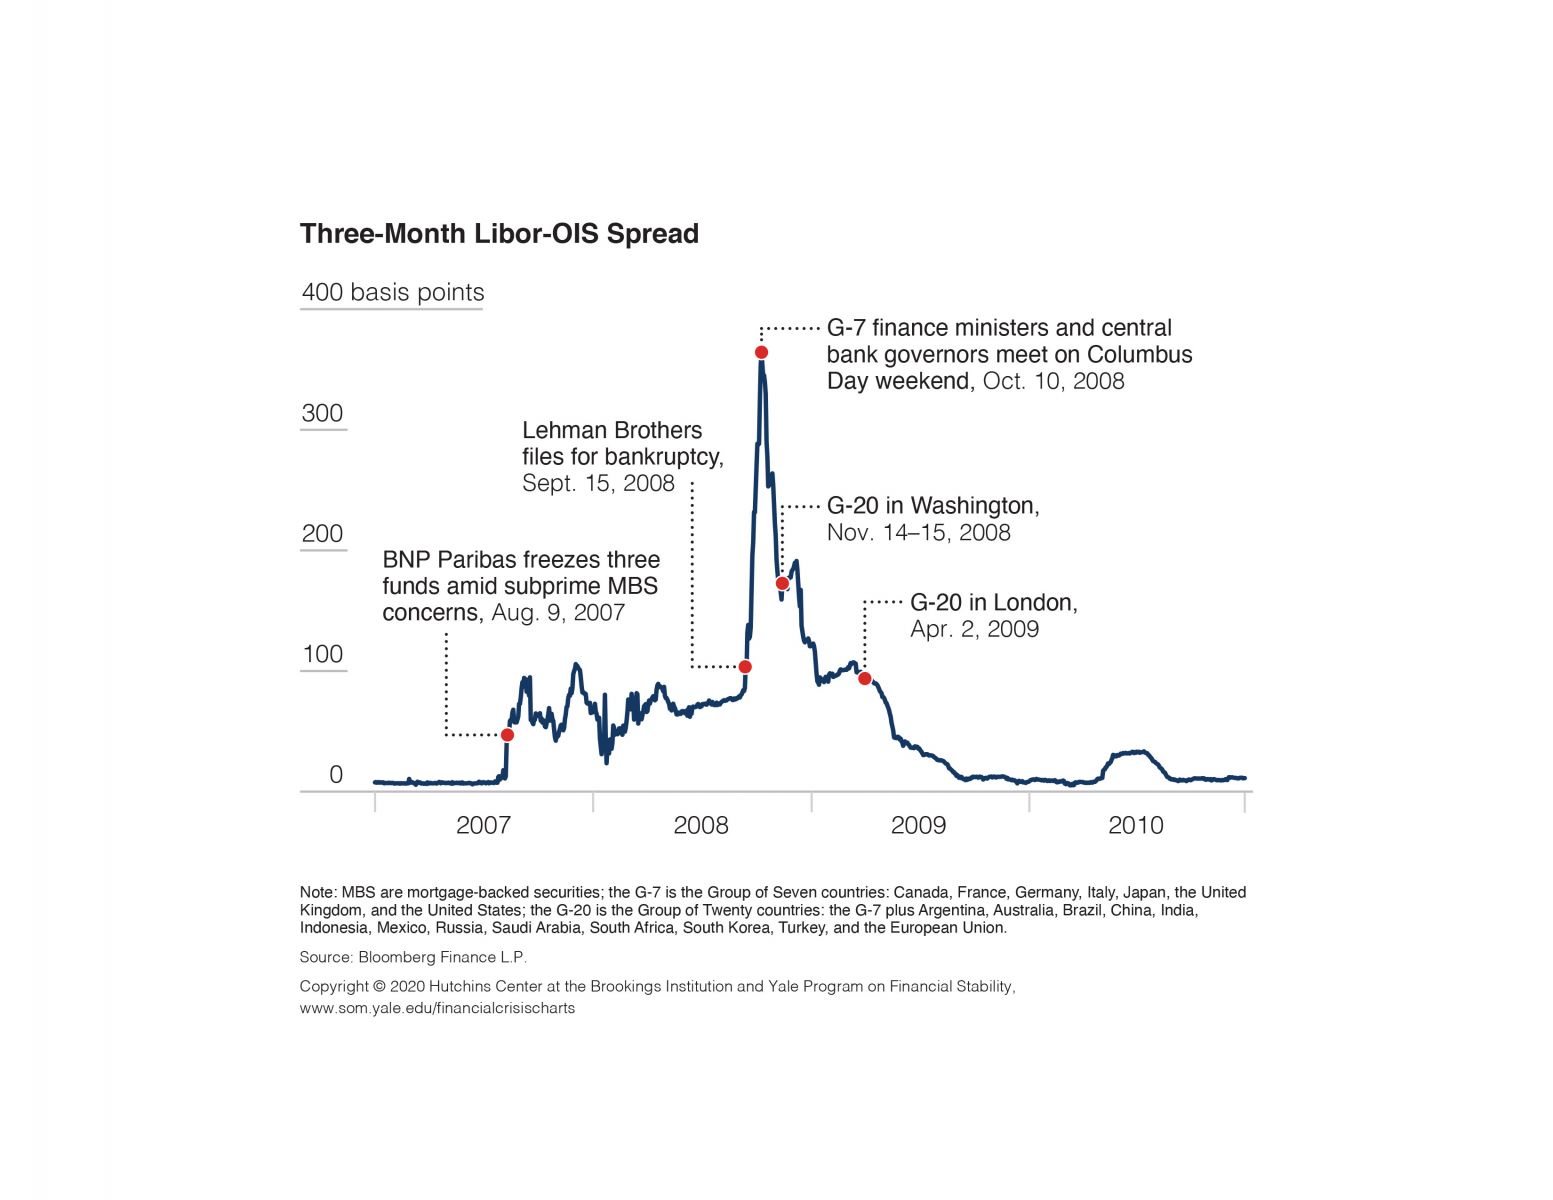
Libor-OIS Spread and Selected Early Crisis Events
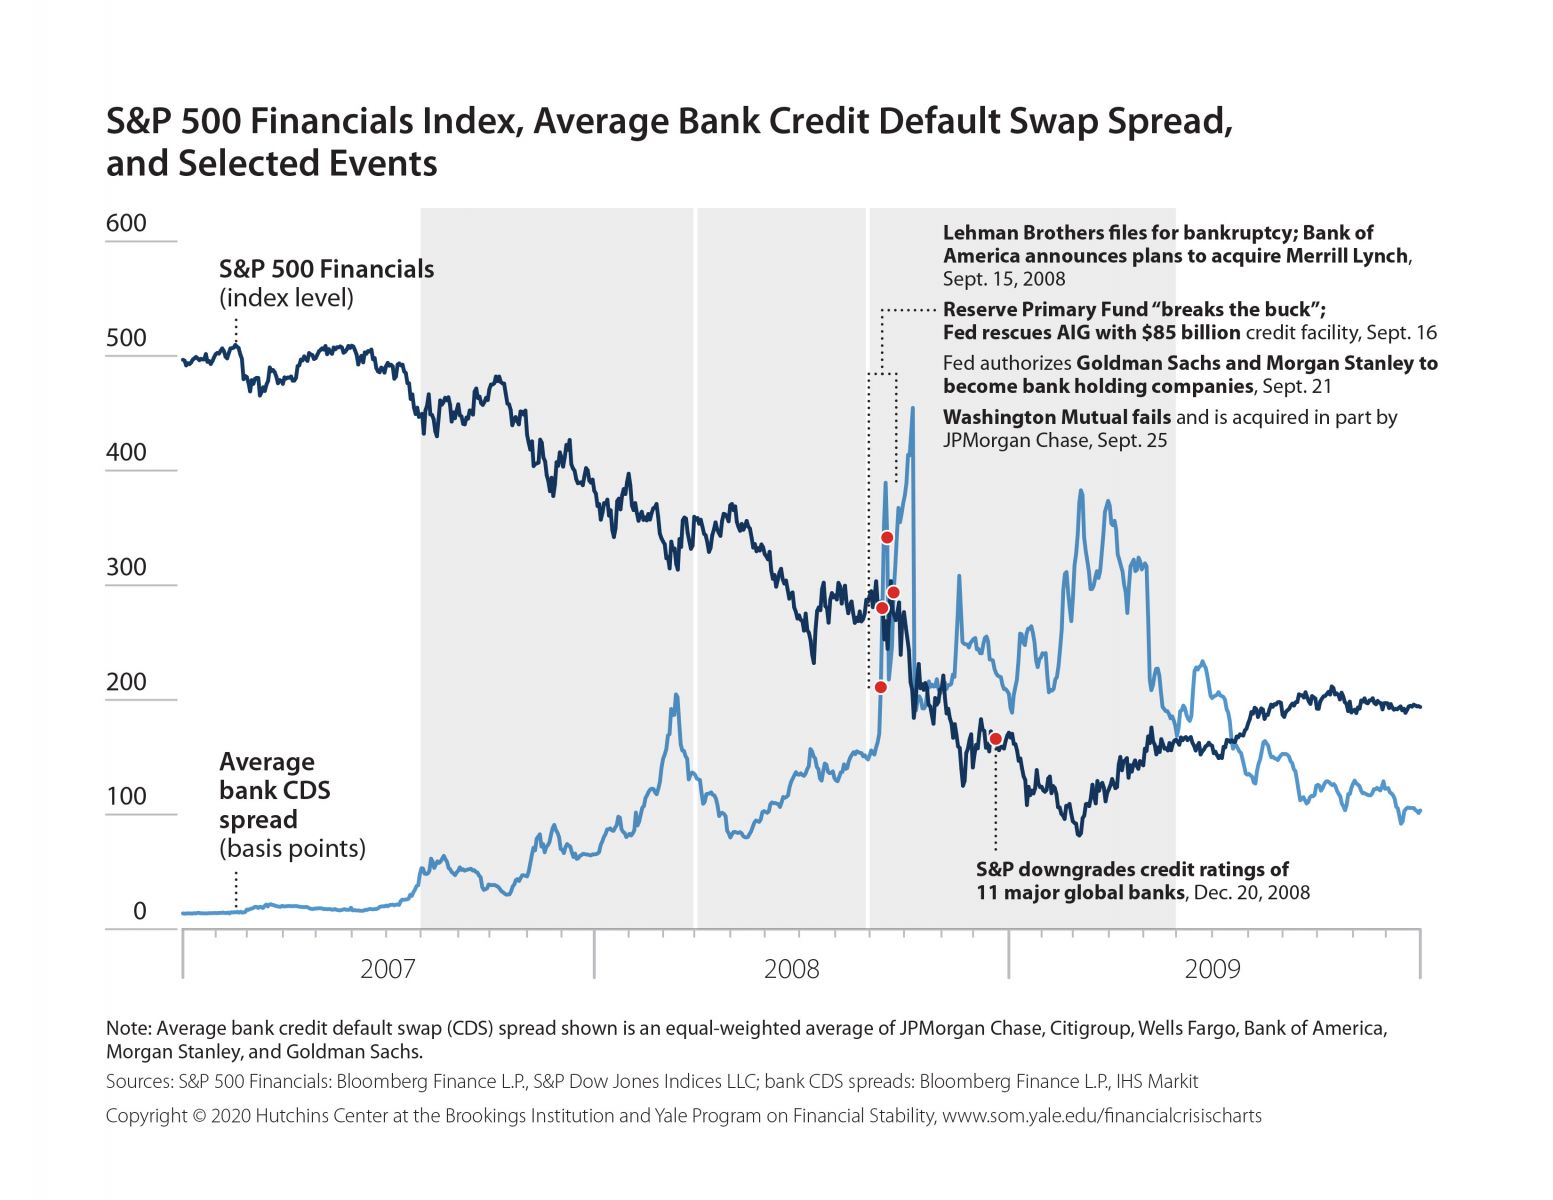
S&P 500 Financials Index, Average Bank Credit Default Swap Spread, and Selected Events, 2007–2009
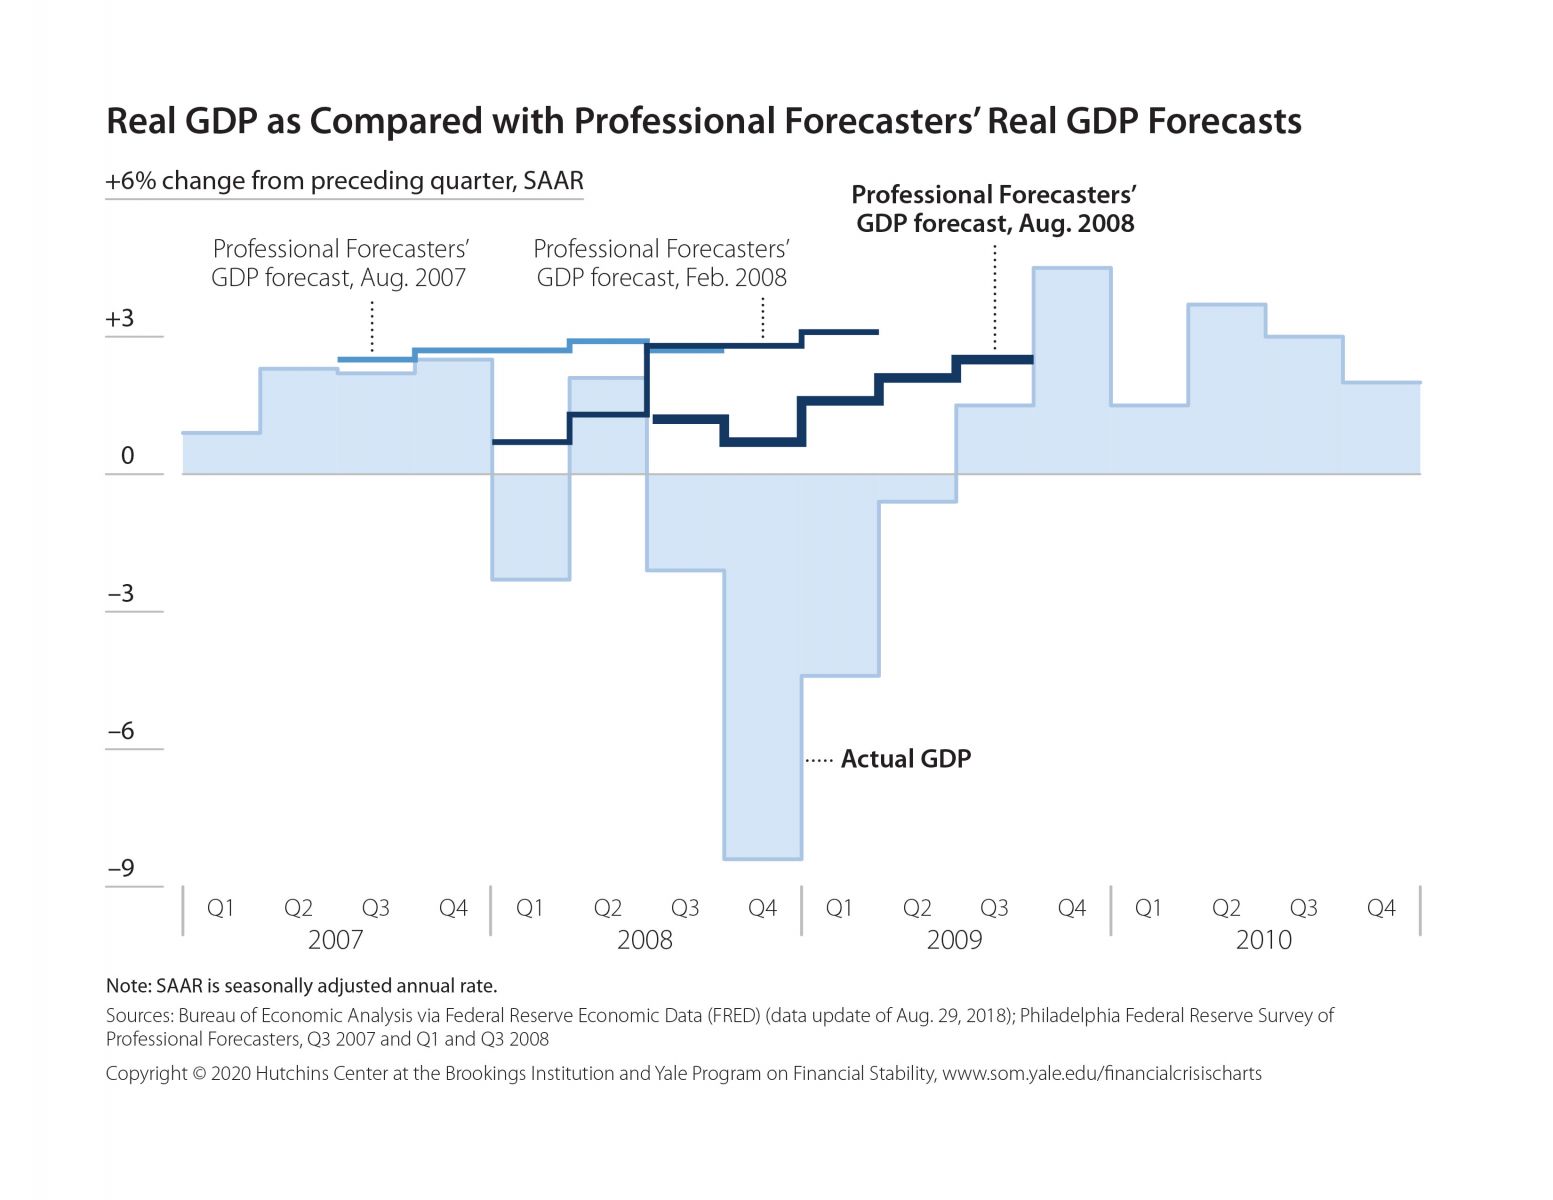
Real GDP as Compared with Professional Forecasters' Real GDP Forecasts, 2007–2010
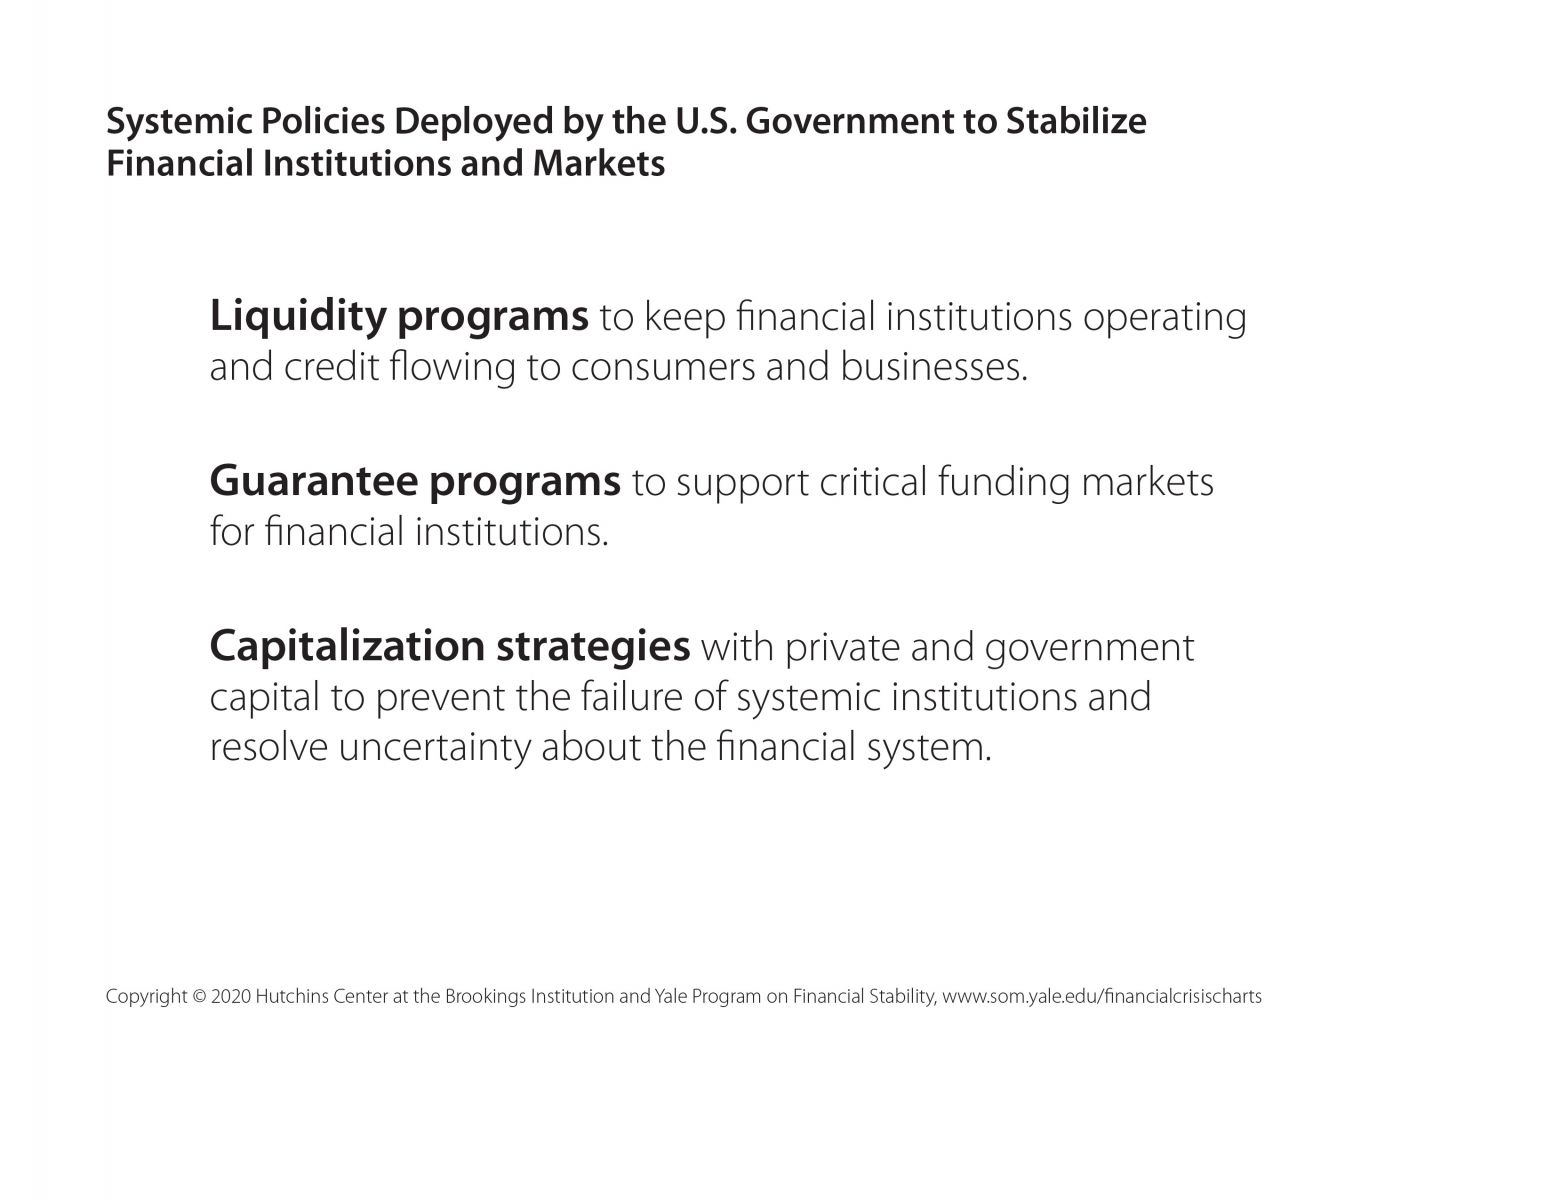
Systemic Financial Policies
Lender of Last Resort
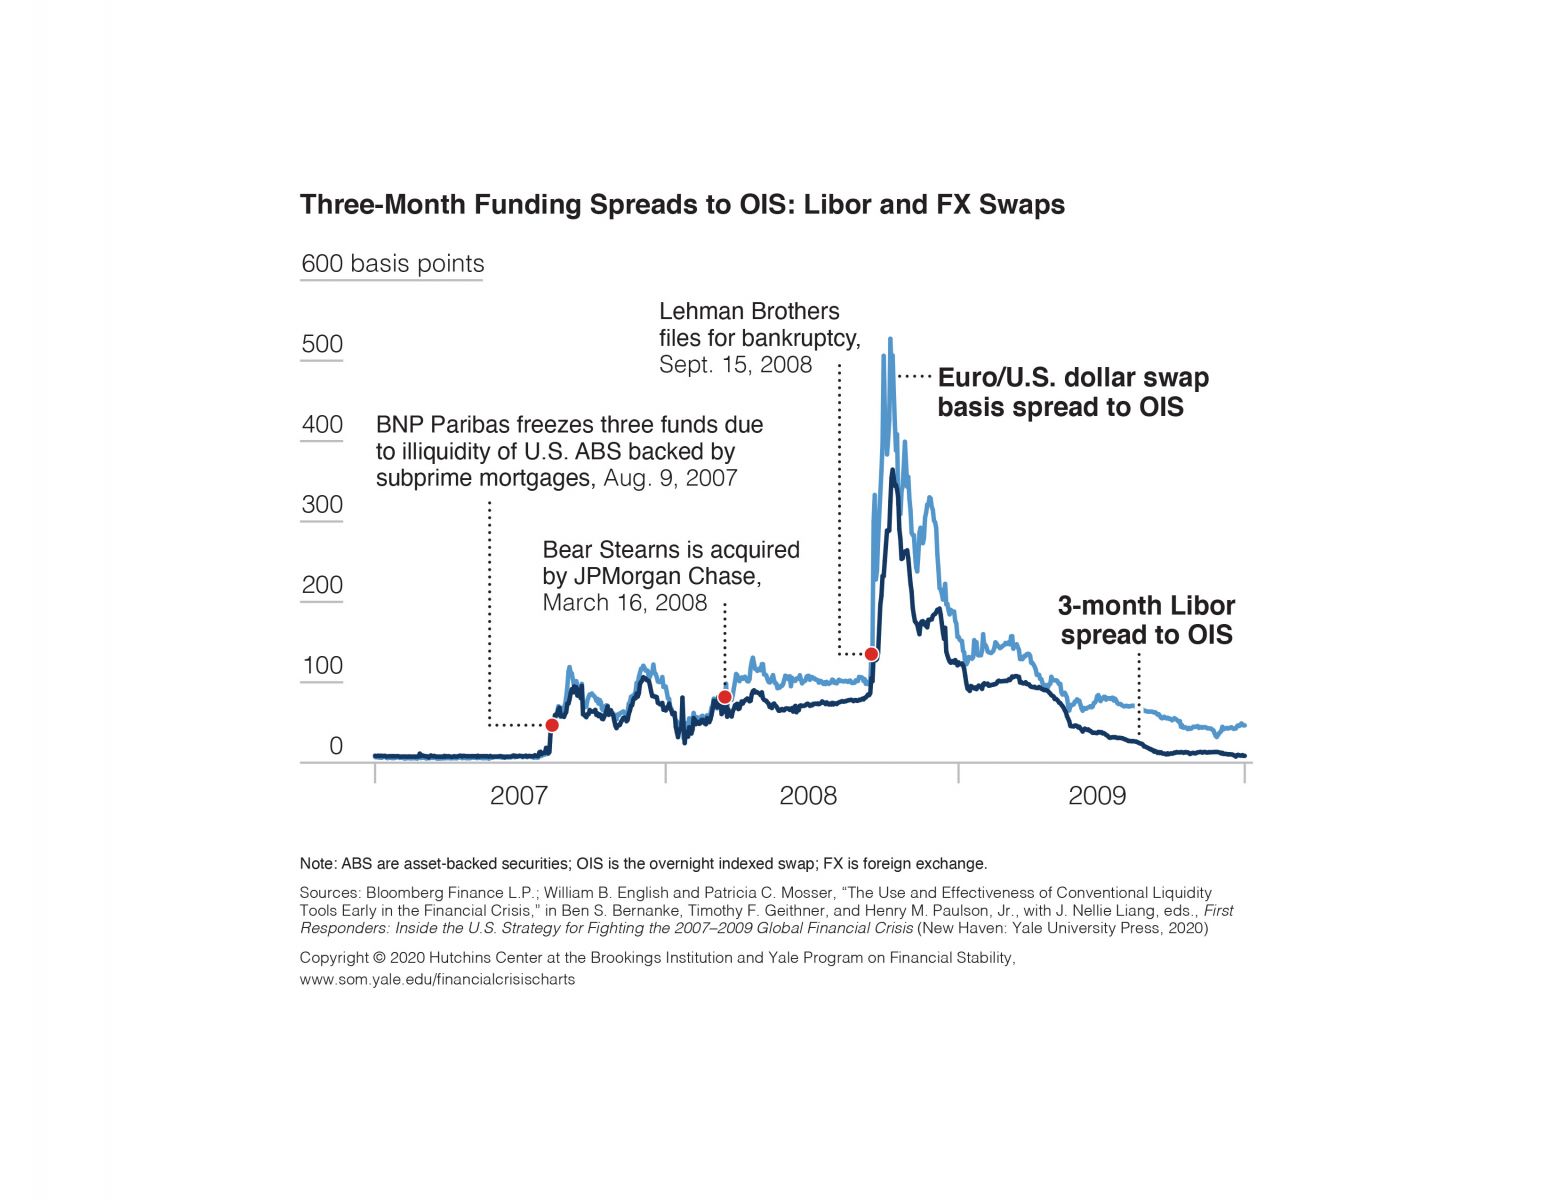
Three-Month Funding Spreads to OIS: Libor and FX Swaps, 2007–2009
Term Auction Facility: Spread to One-Month OIS and Amount Outstanding, Q4 2007–Q4 2009
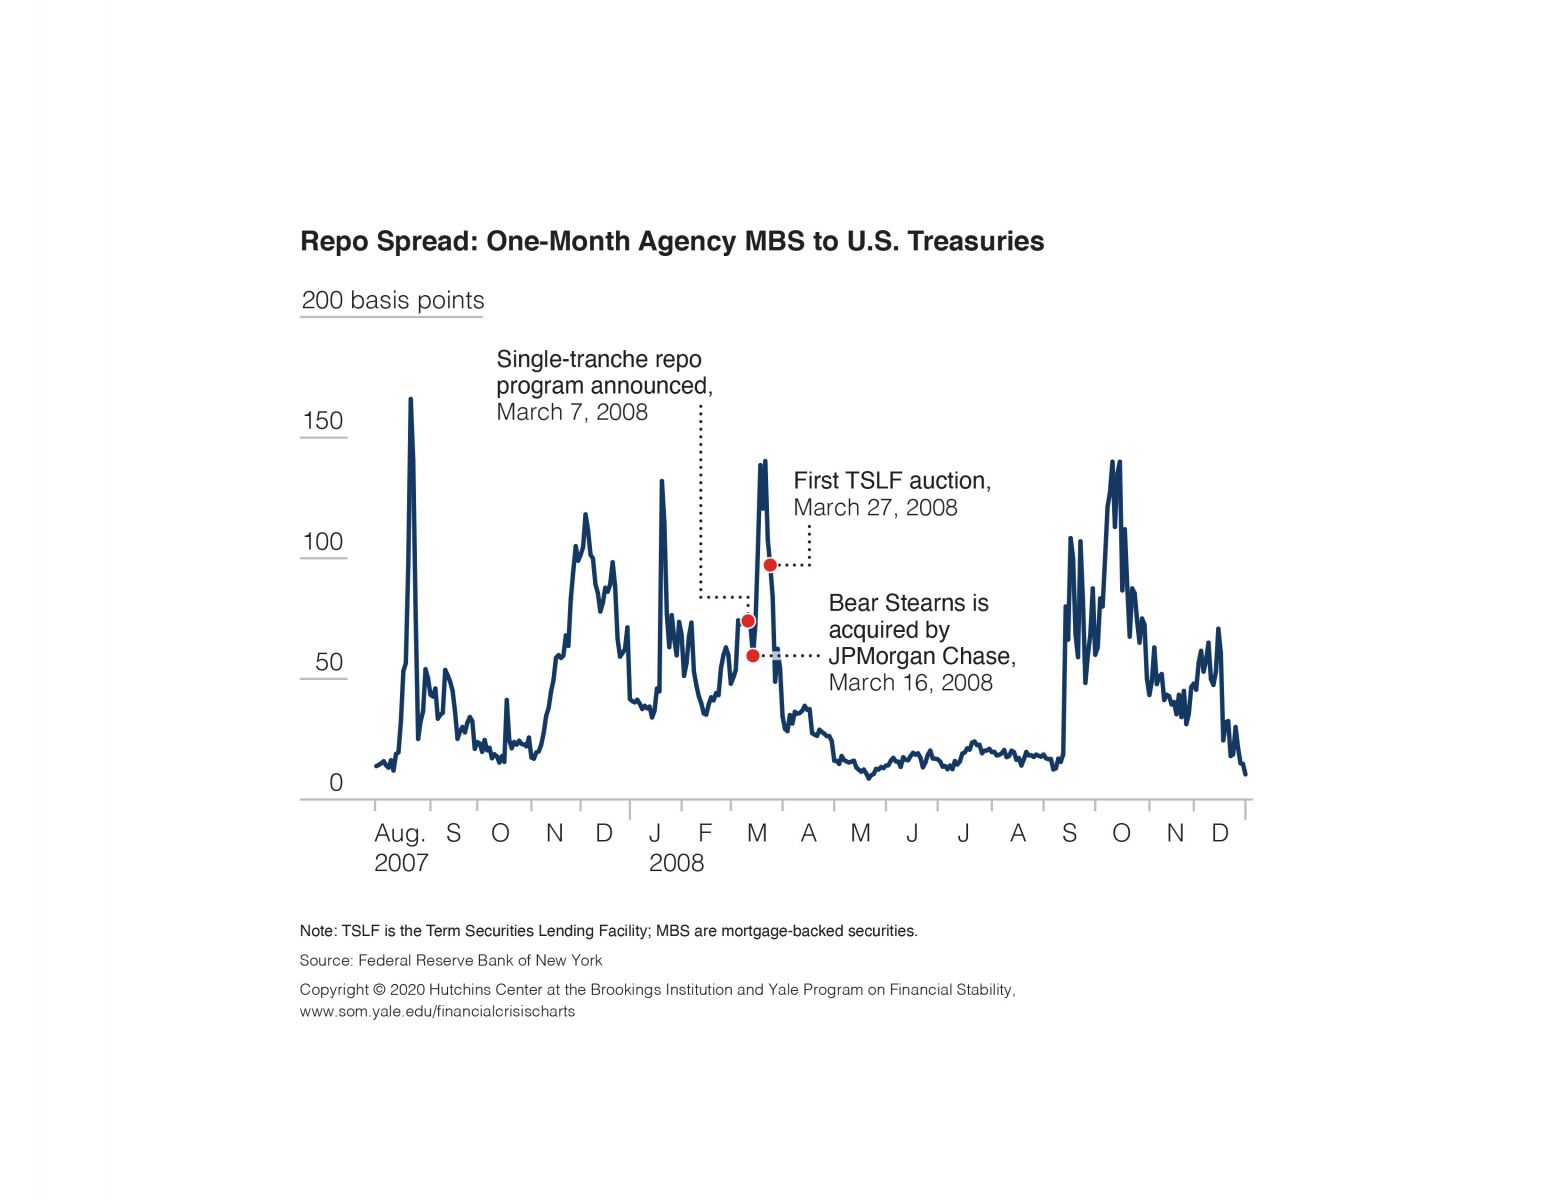
Repo Spread: One-Month Agency MBS to U.S. Treasuries, August 2007–December 2008
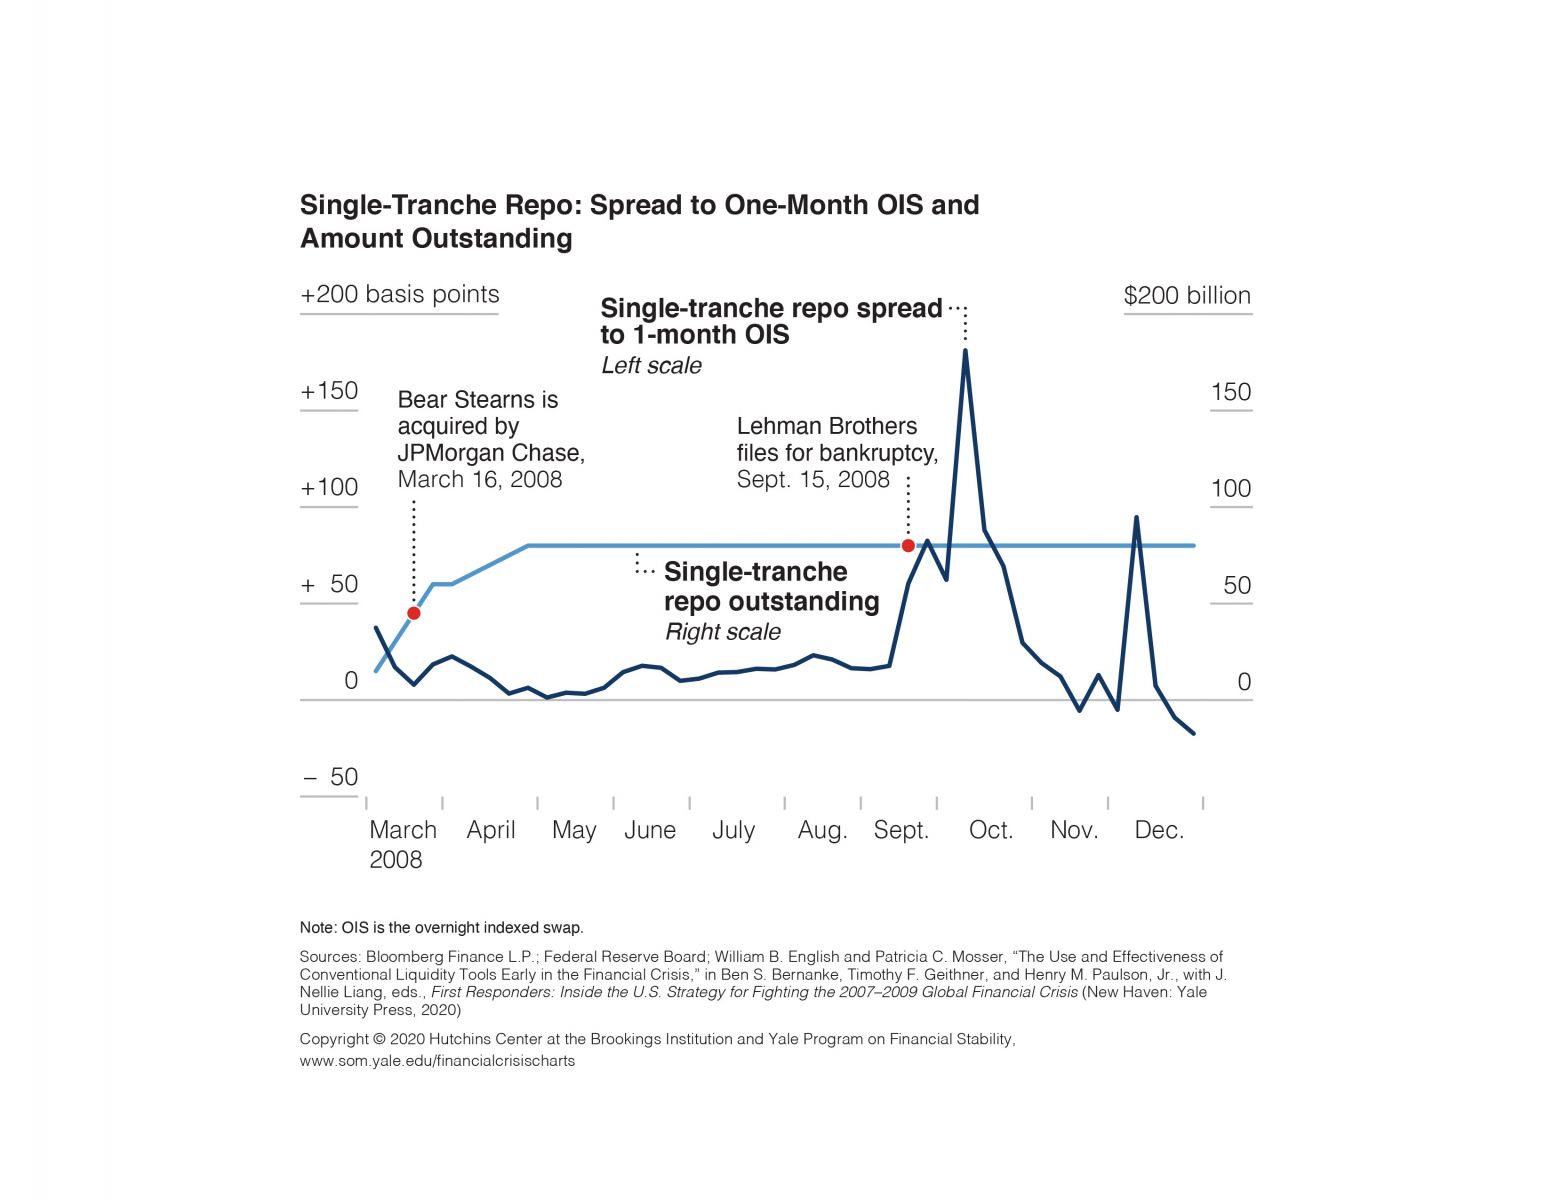
Single-Tranche Repo: Spread to One-Month OIS and Amount Outstanding, March–December 2008
Discount Window: Amounts Outstanding by Region, August 2007–February 2010
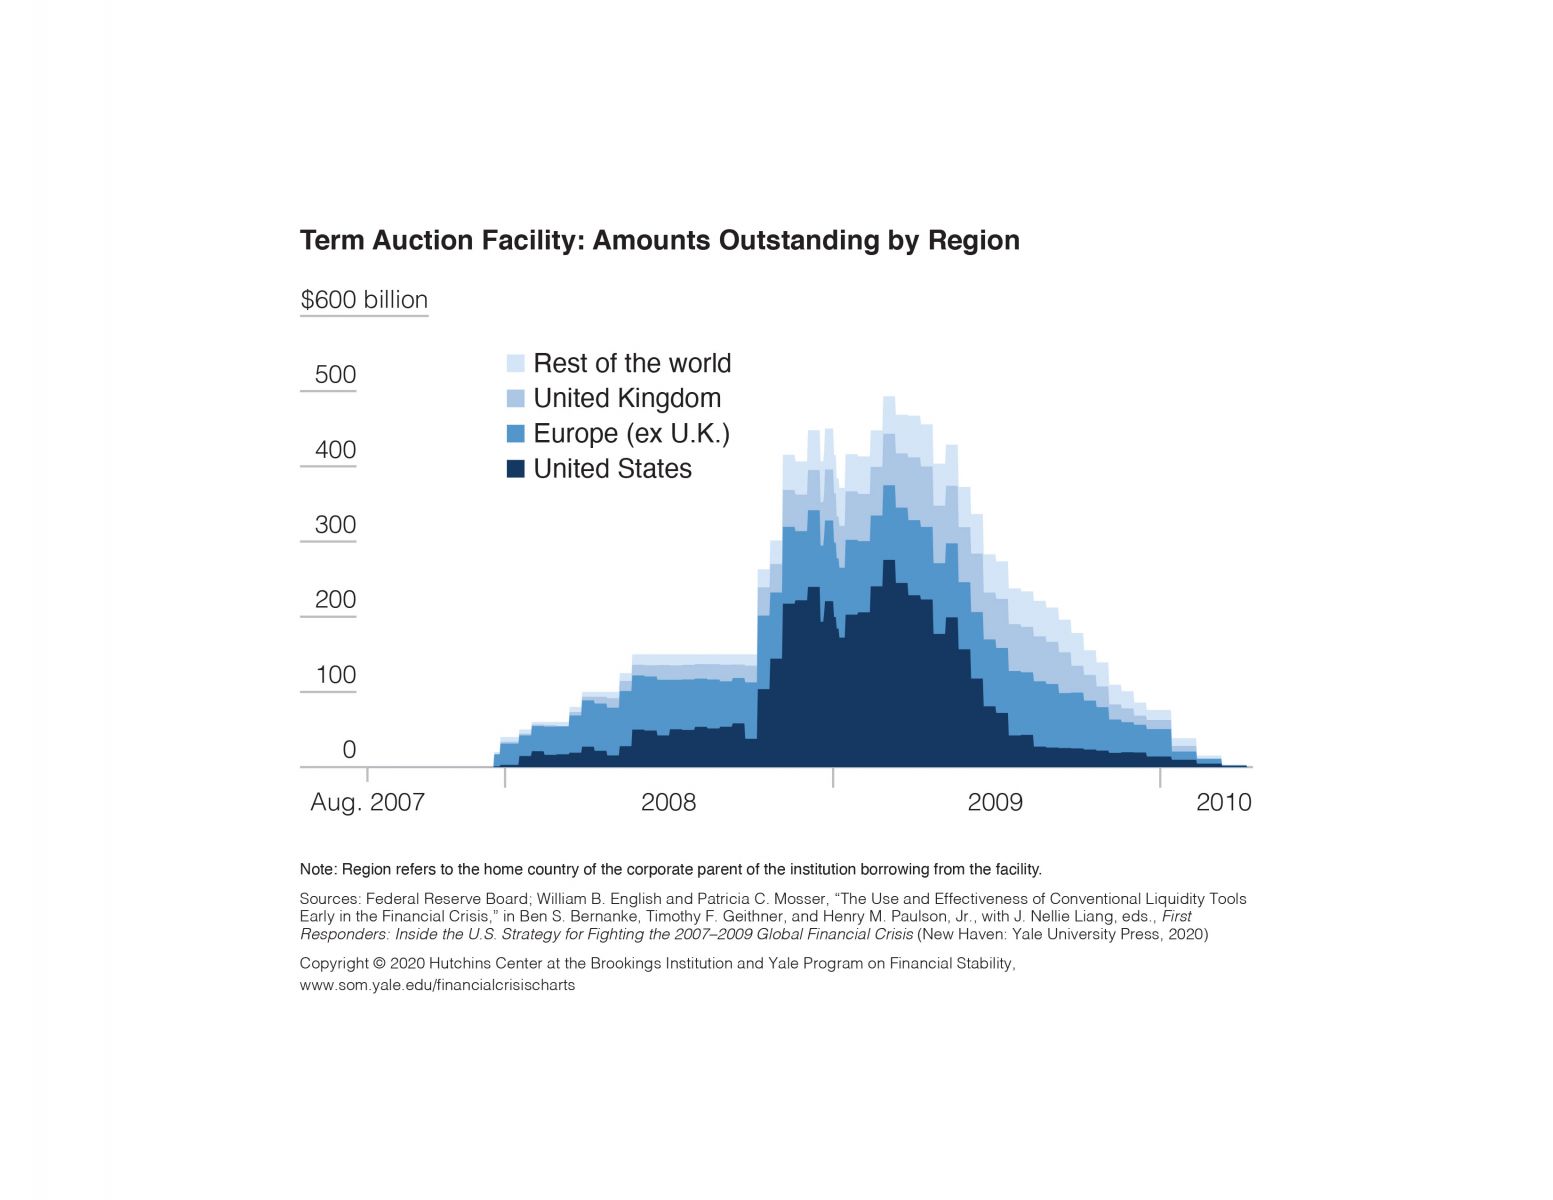
Term Auction Facility: Amounts Outstanding by Region, August 2007–April 2010
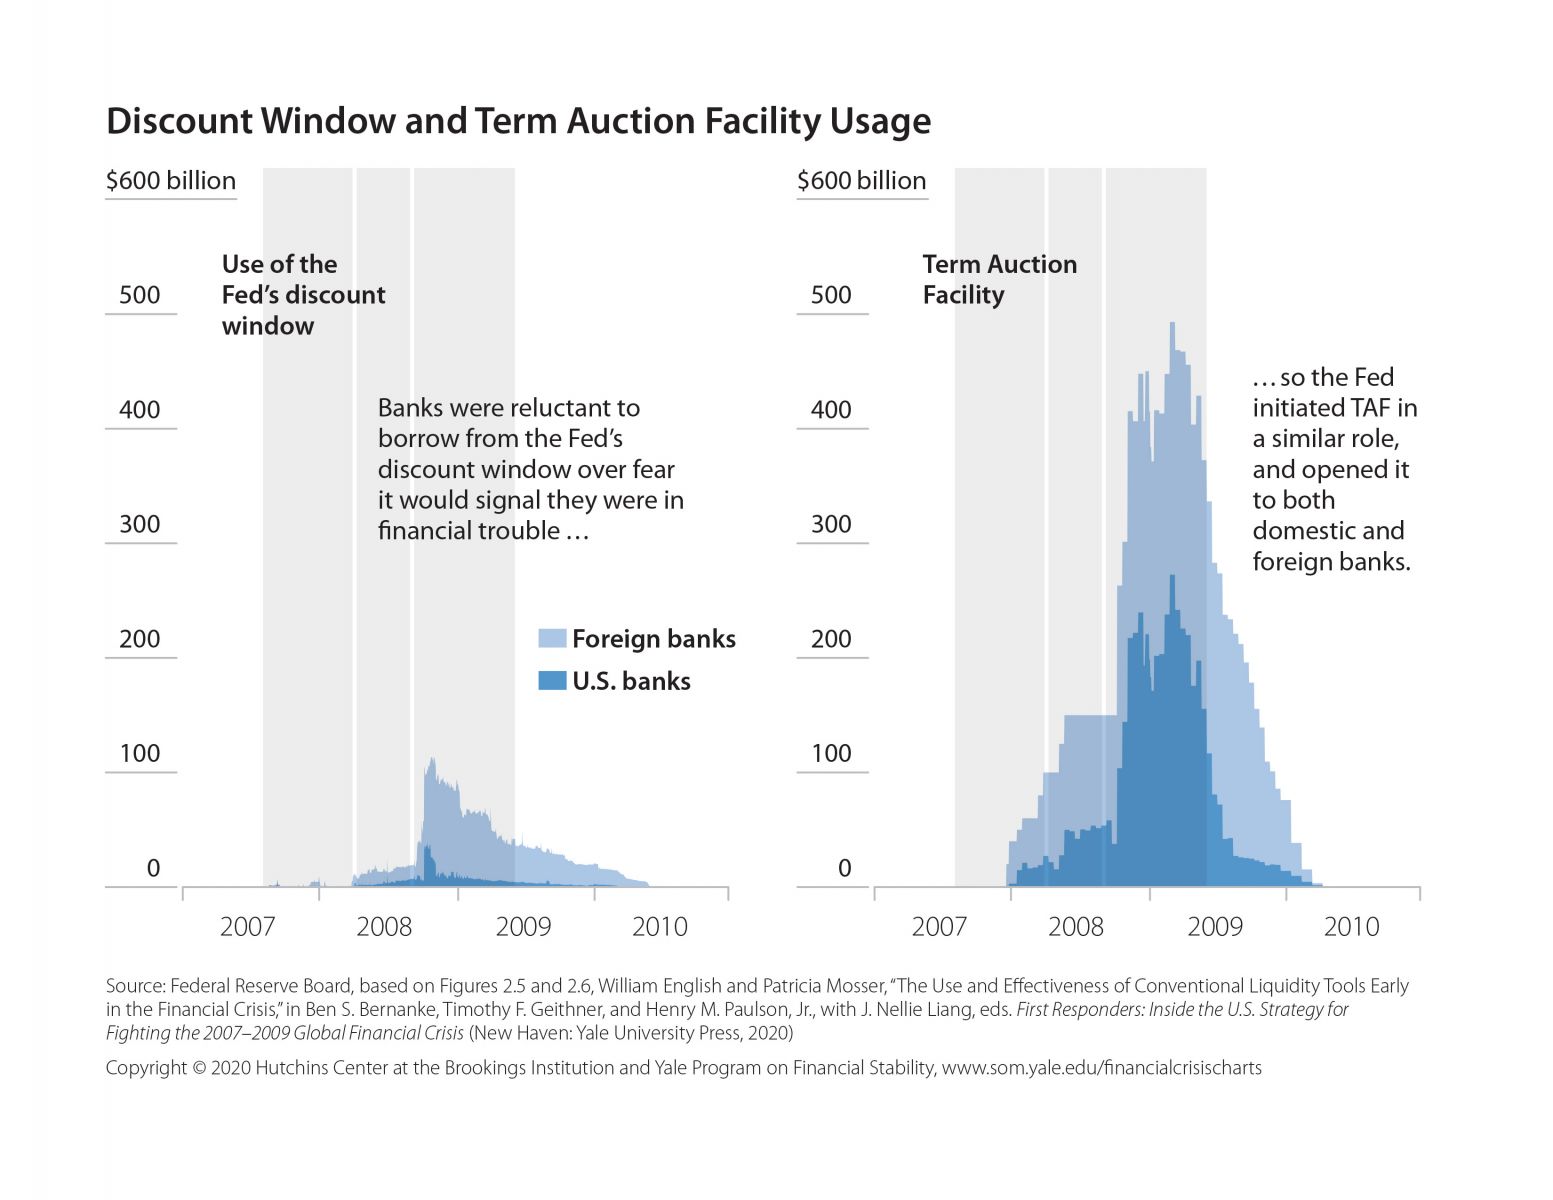
Discount Window and Term Auction Facility Usage, 2007–2010
Single-Tranche Repo: Amounts Outstanding by Region, January 2008 – June 2009
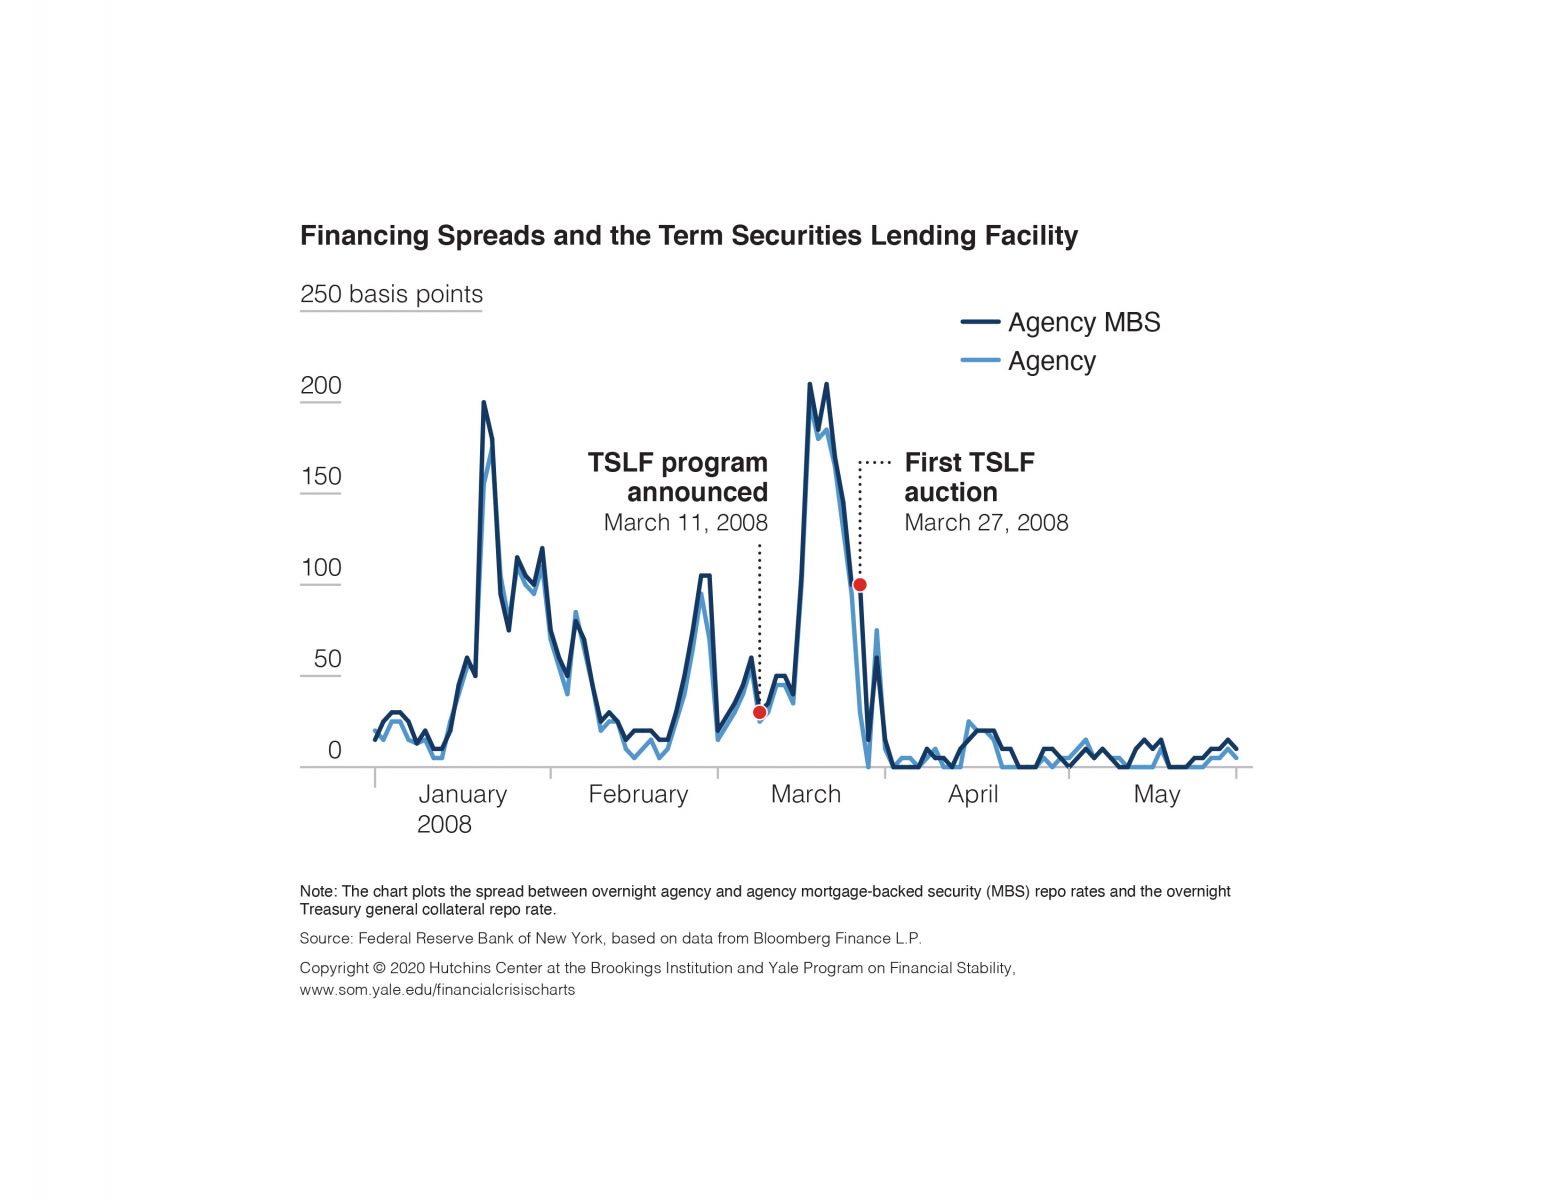
Financing Spreads and the Term Securities Lending Facility, January–May 2008
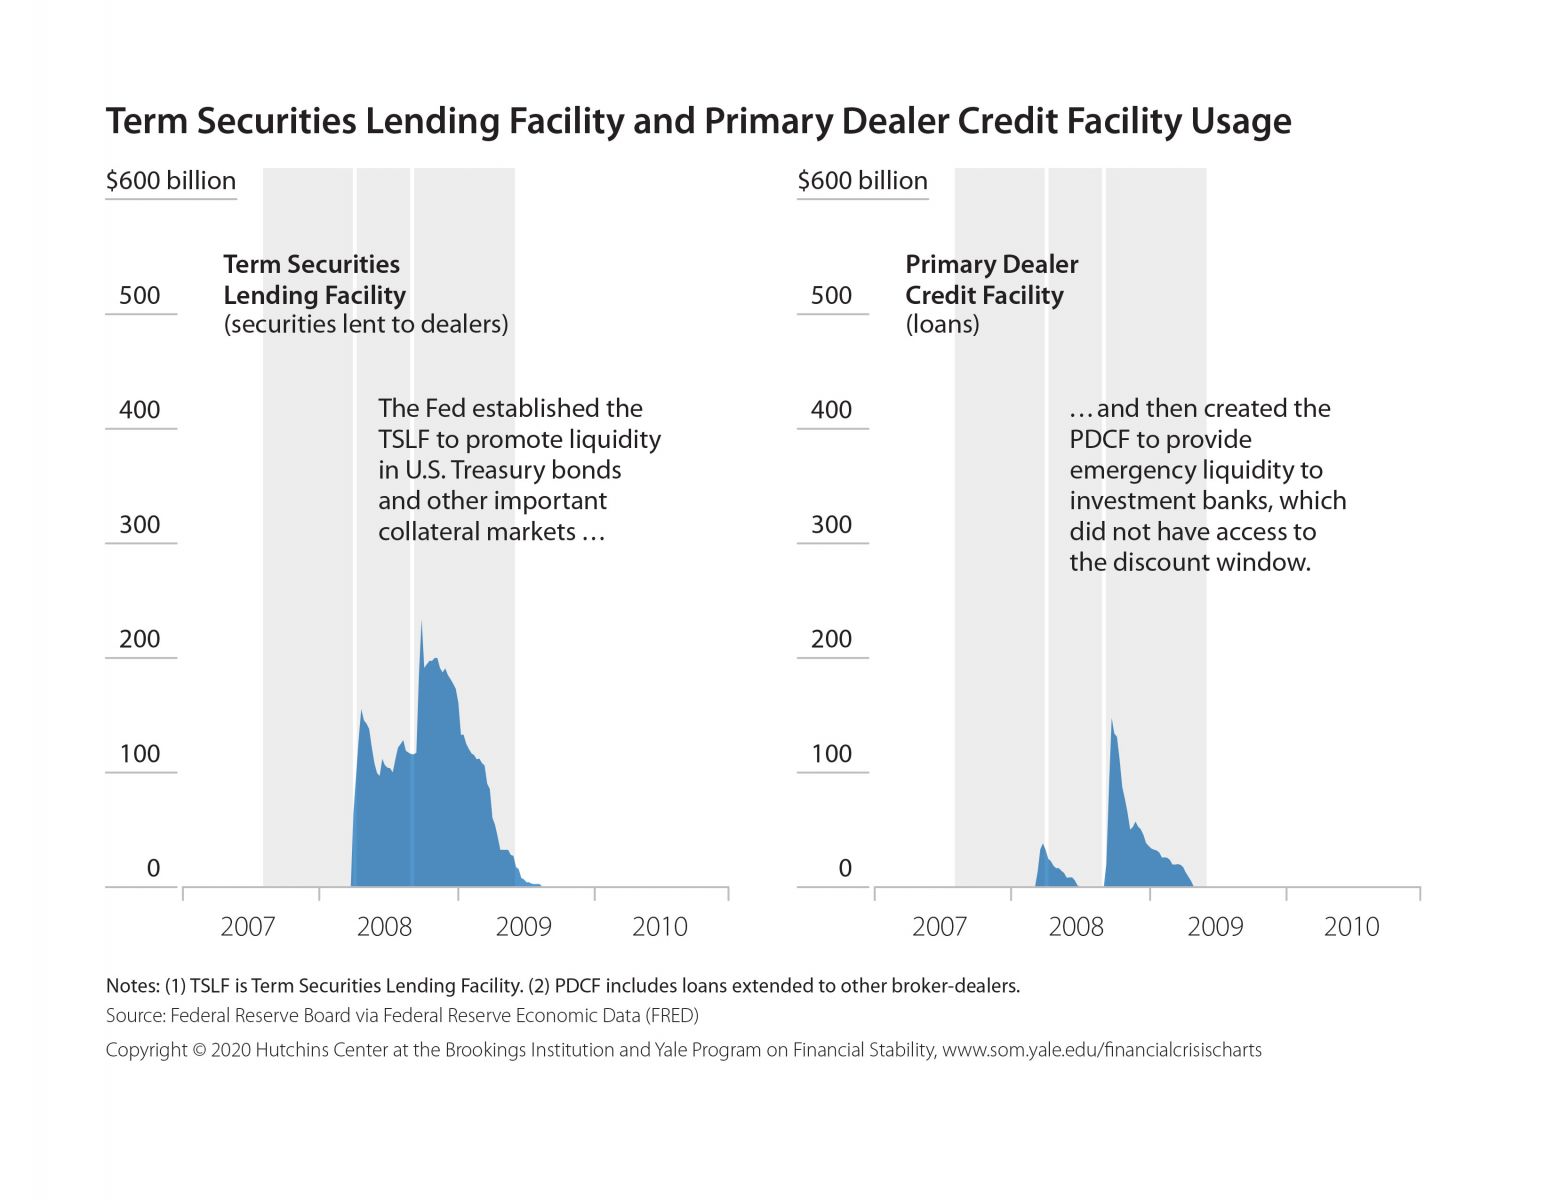
Term Securities Lending Facility and Primary Dealer Credit Facility Usage, 2007–2010
Credit Default Swap Spreads for Banks and Securities Firms, January 2008–July 2009, and the Announcement of the PDCF
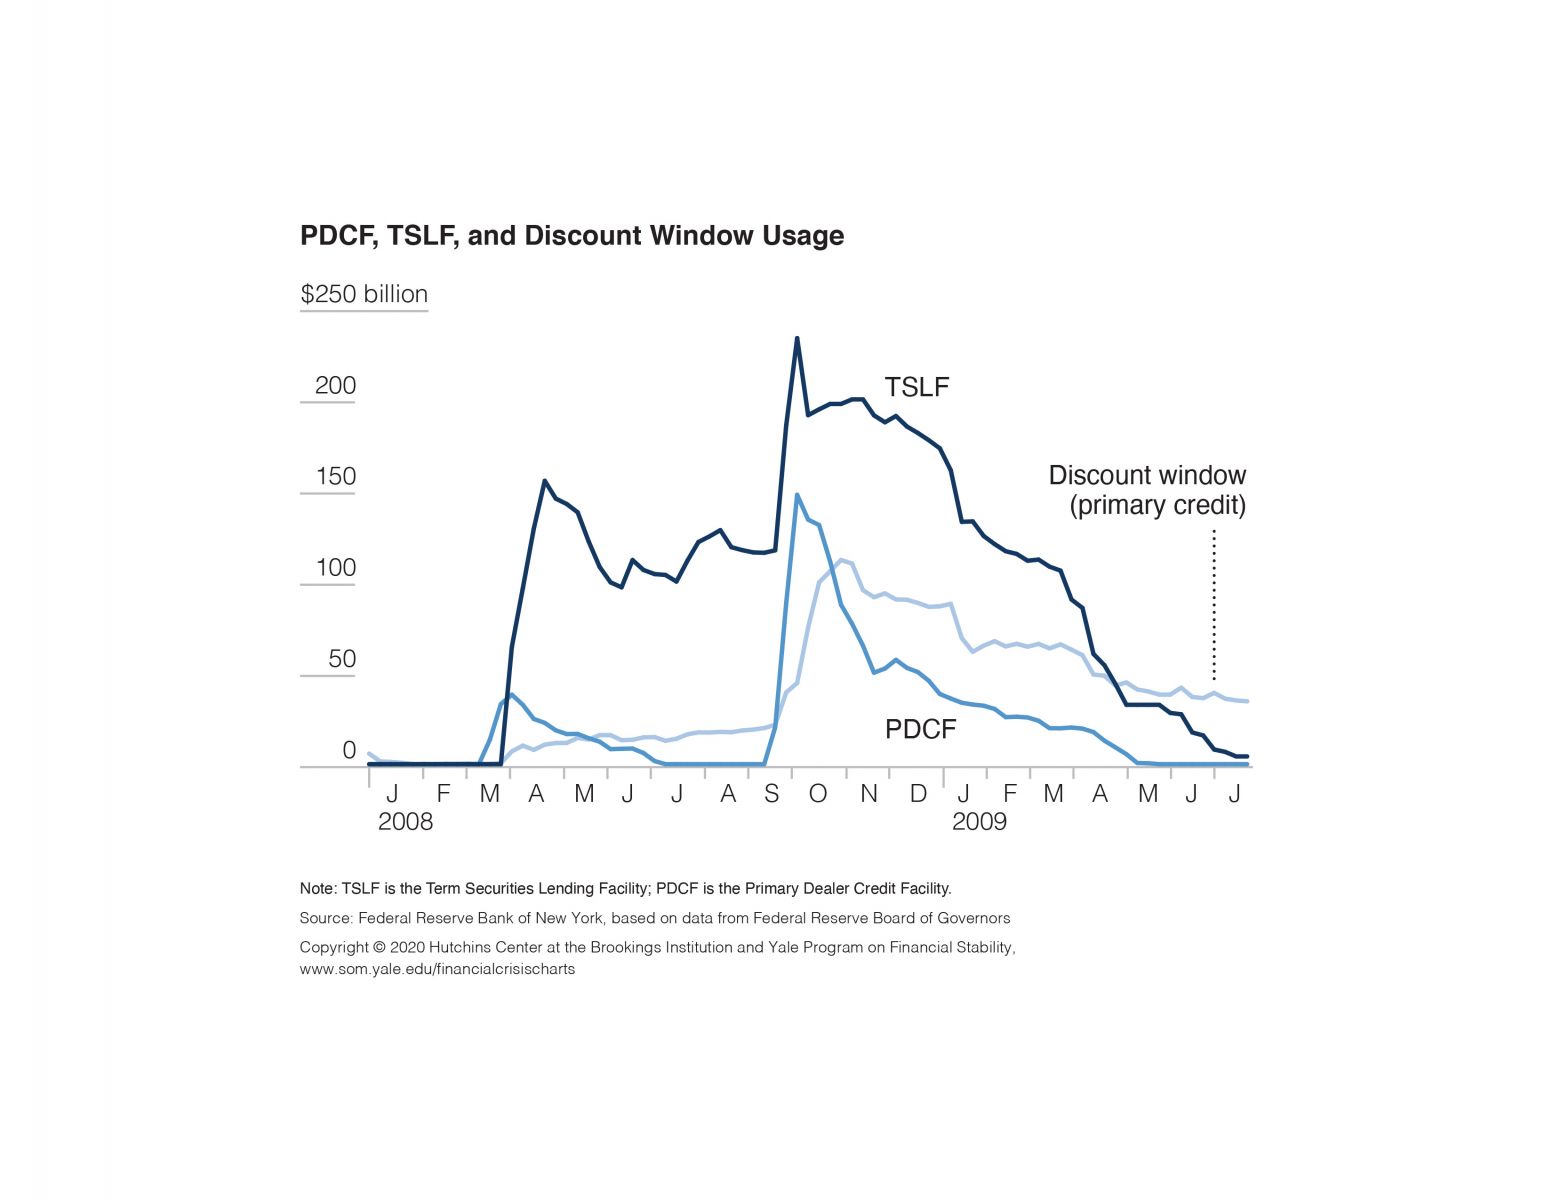
PDCF, TSLF, and Discount Window Usage, January 1, 2008 – July 15, 2009
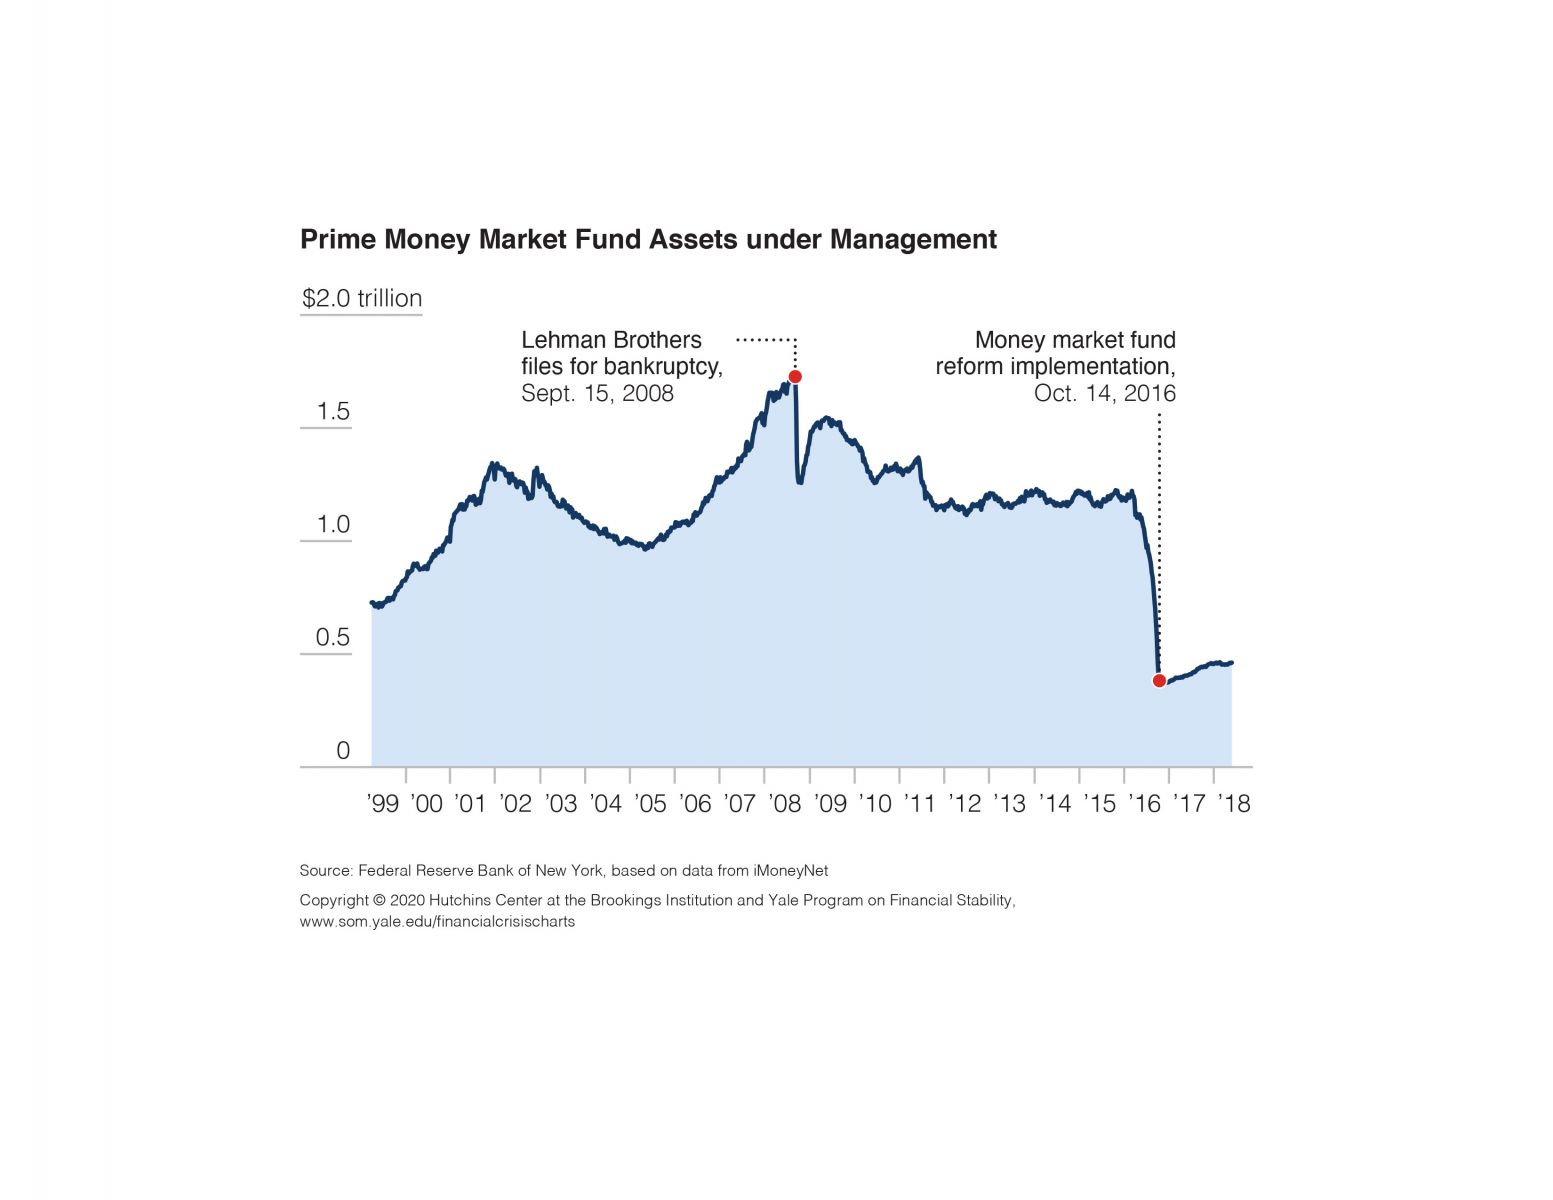
Prime Money Market Fund Assets under Management, 1999–2018
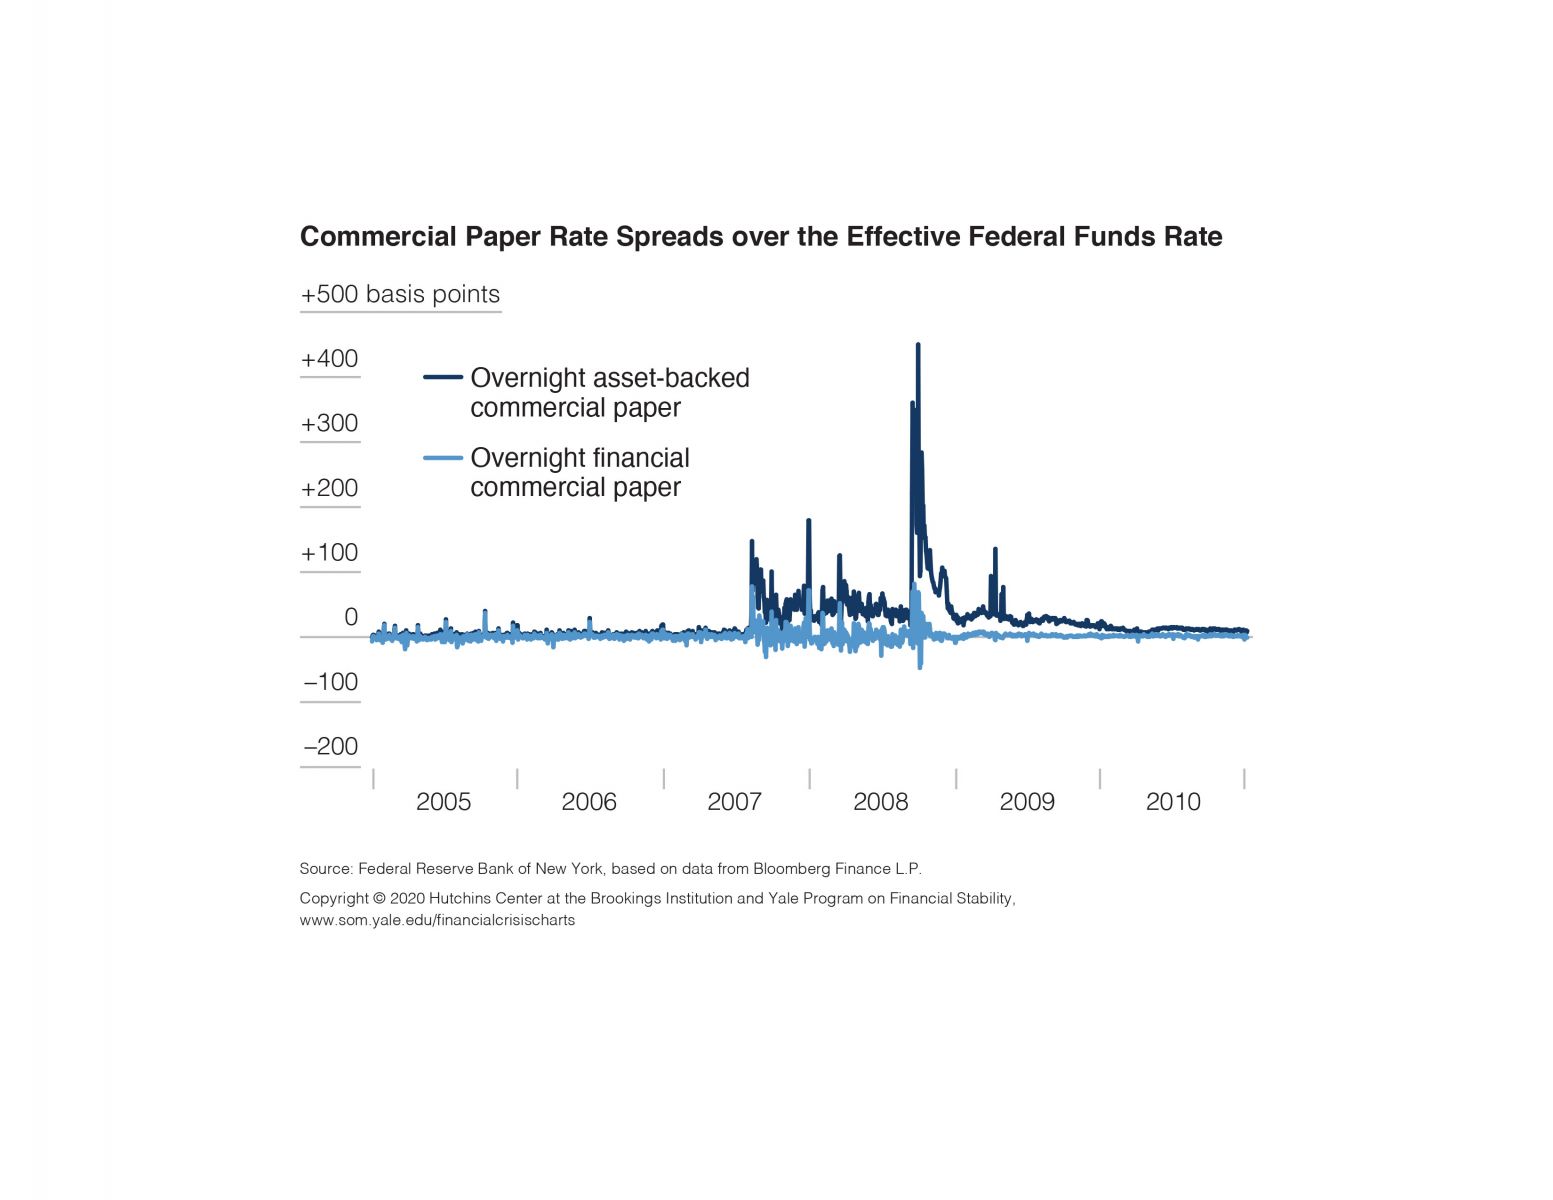
Commercial Paper Rate Spreads over the Effective Federal Funds Rate, 2005–2010
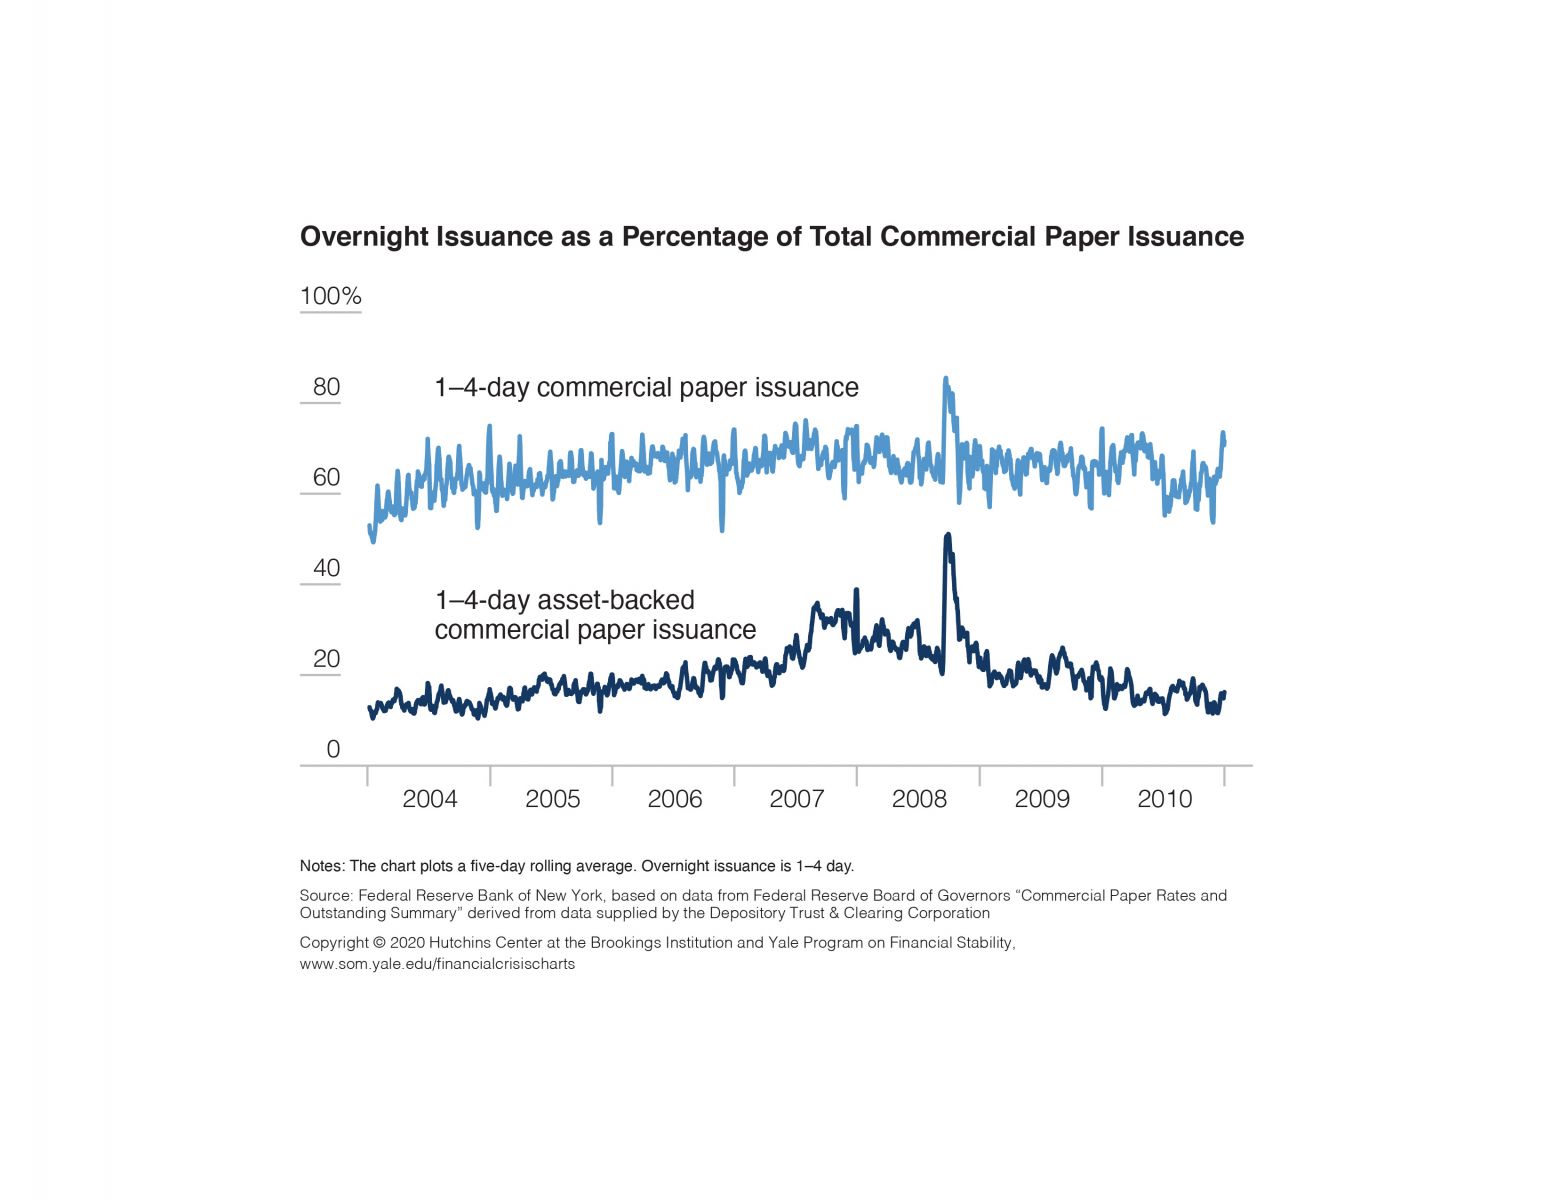
Overnight Issuance as a Percentage of Total Commercial Paper Issuance, 2004–2010
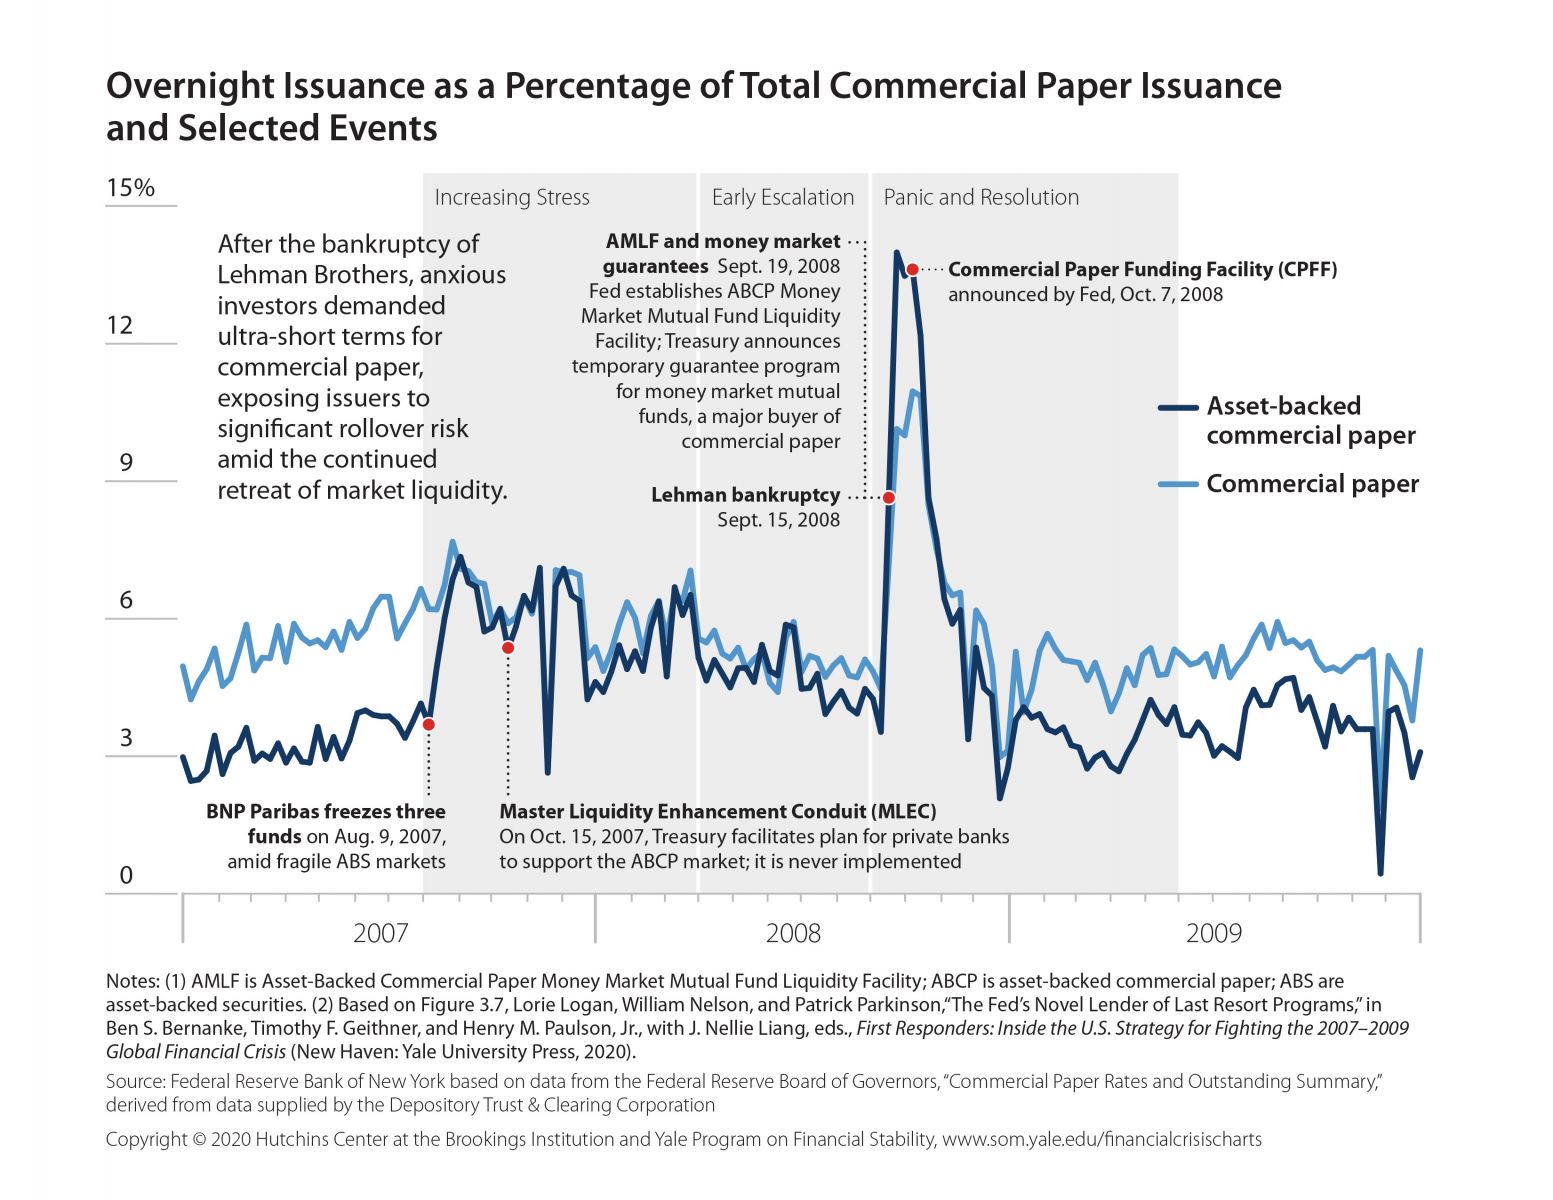
Overnight Issuance as a Percentage of Total Commercial Paper Issuance and Selected Events, 2007–2010
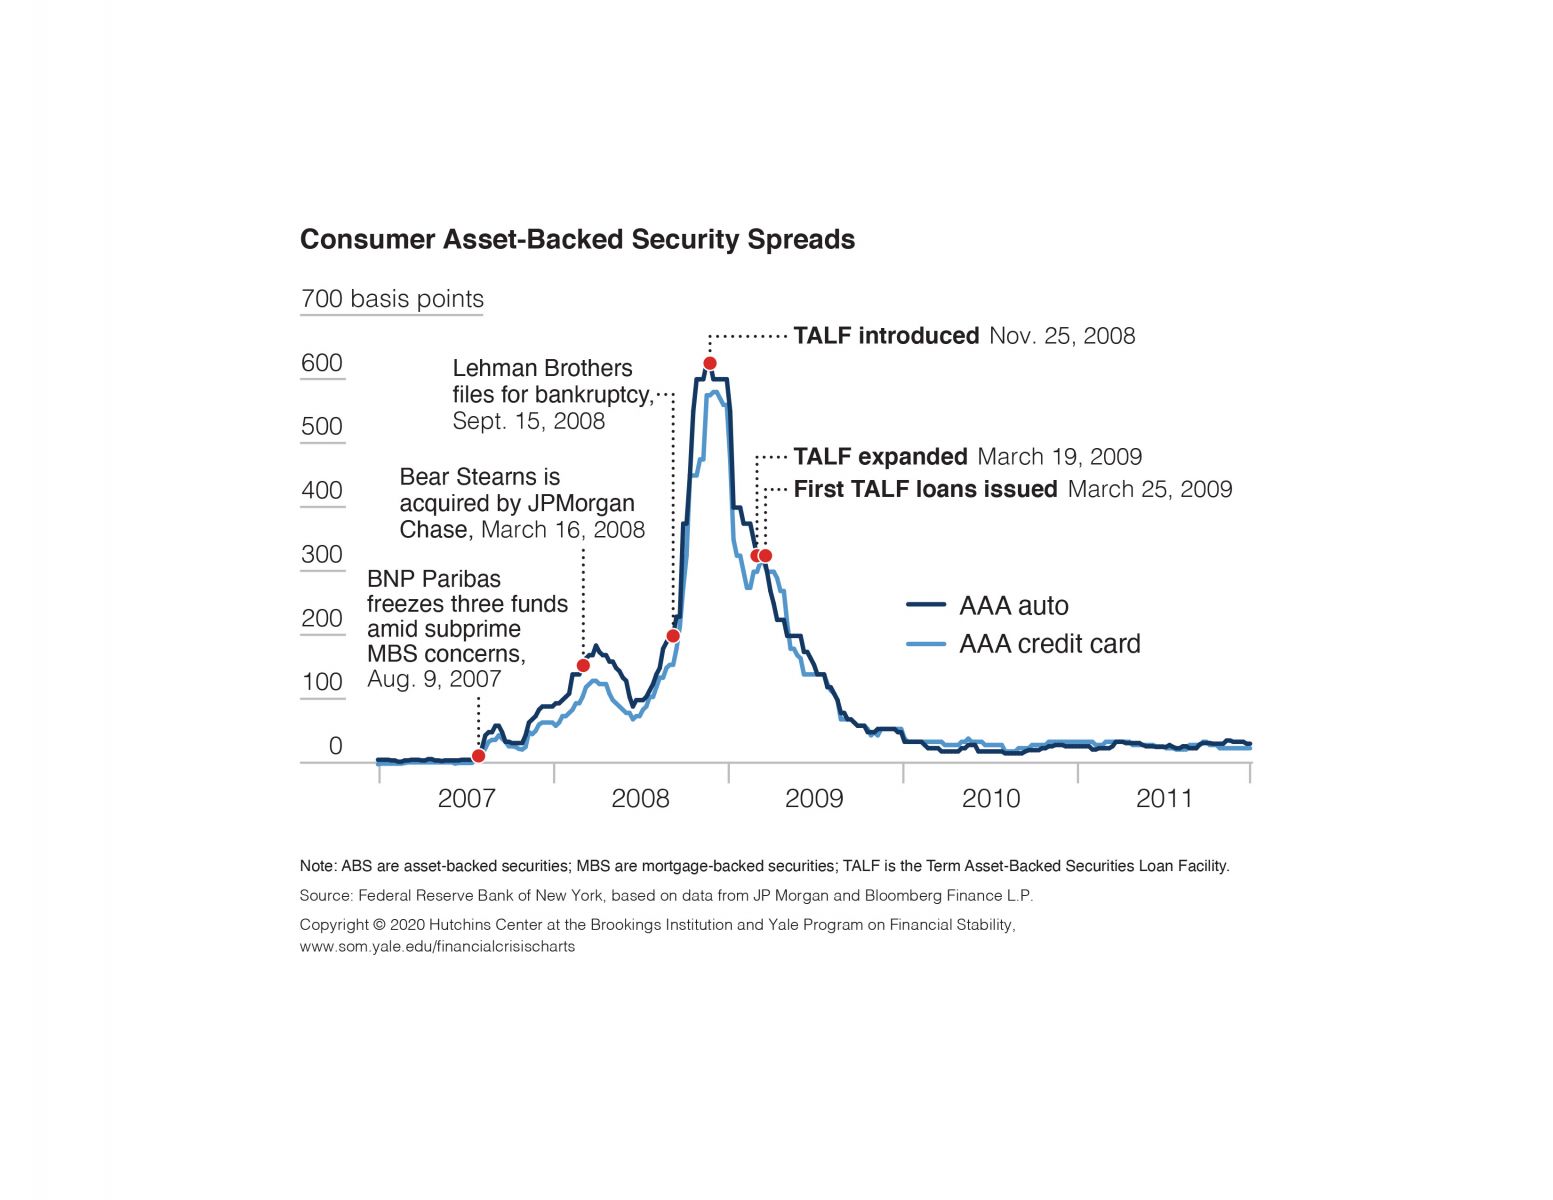
Consumer Asset-Backed Security Spreads, 2007–2011
Commercial Mortgage-Backed Security Spreads, 2007–2011
Outstanding Term Asset-Backed Securities Loan Facility Loans, Weekly, 2009–2011
Total Issuance in TALF-Eligible Classes and Breakdown of TALF Issuance, 2007–2011
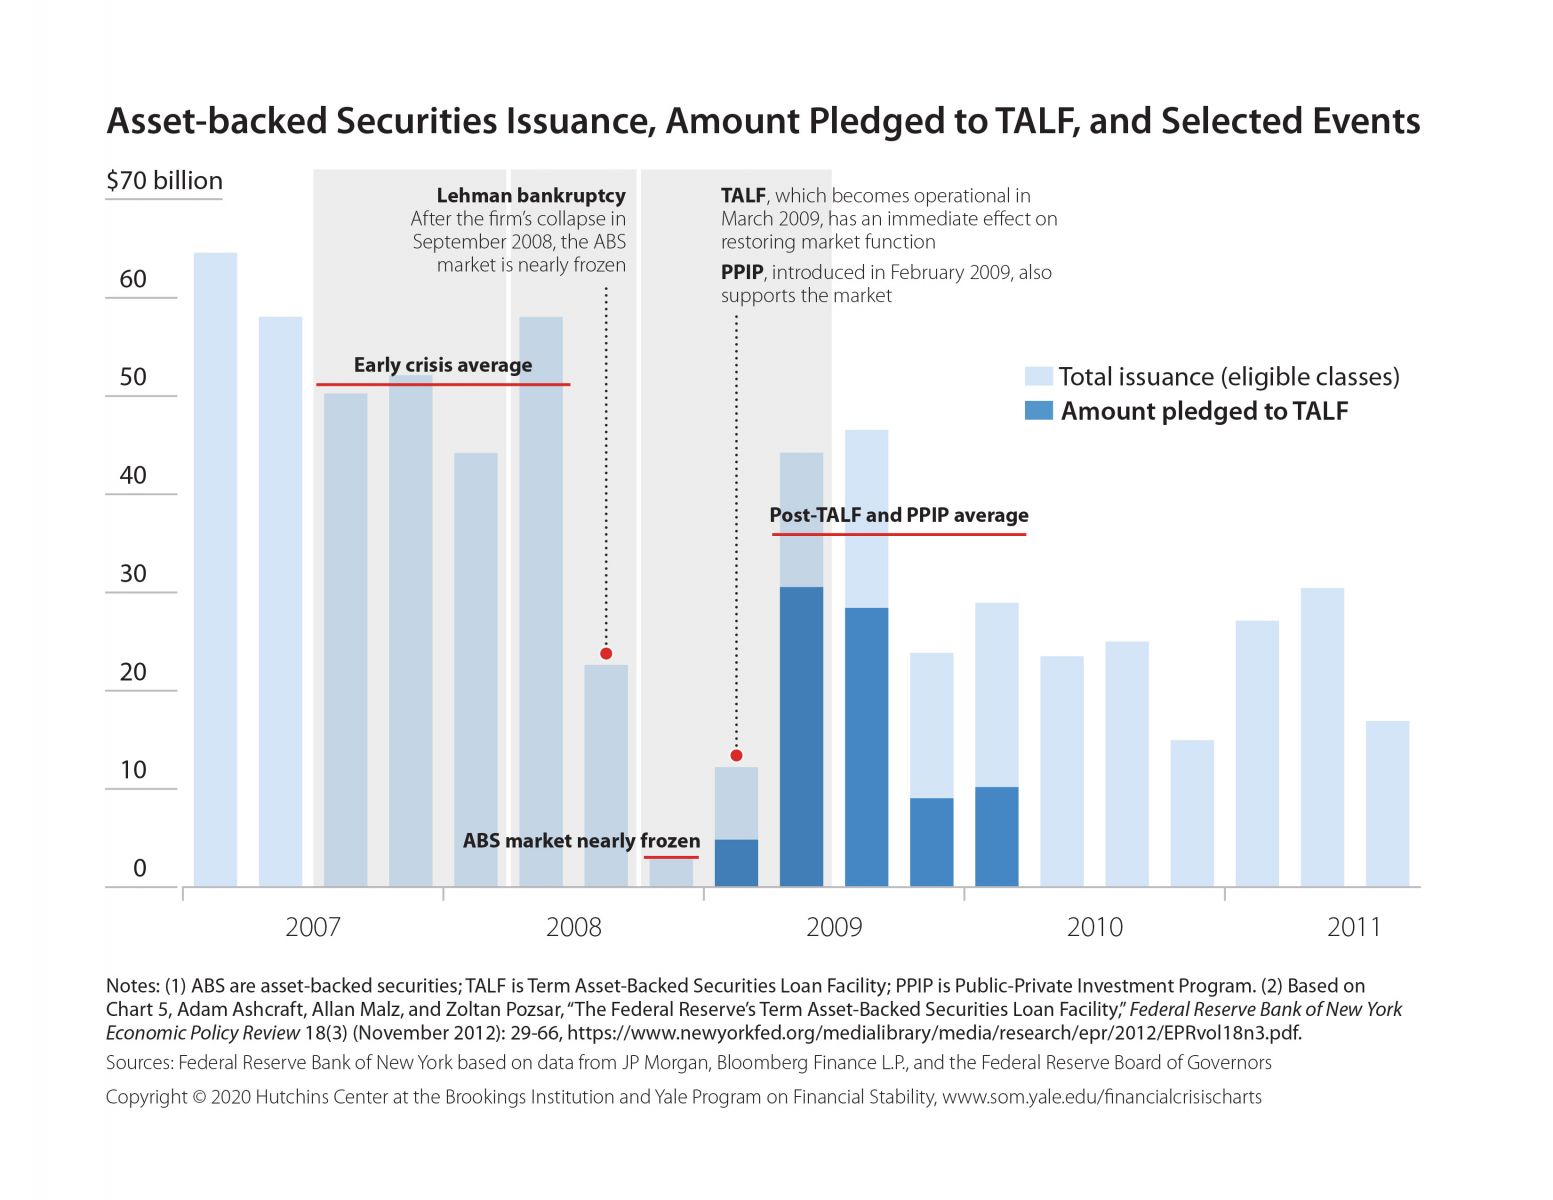
Asset-backed Securities Issuance, Amount Pledged to TALF, and Selected Events, 2007–2011
Guarantees
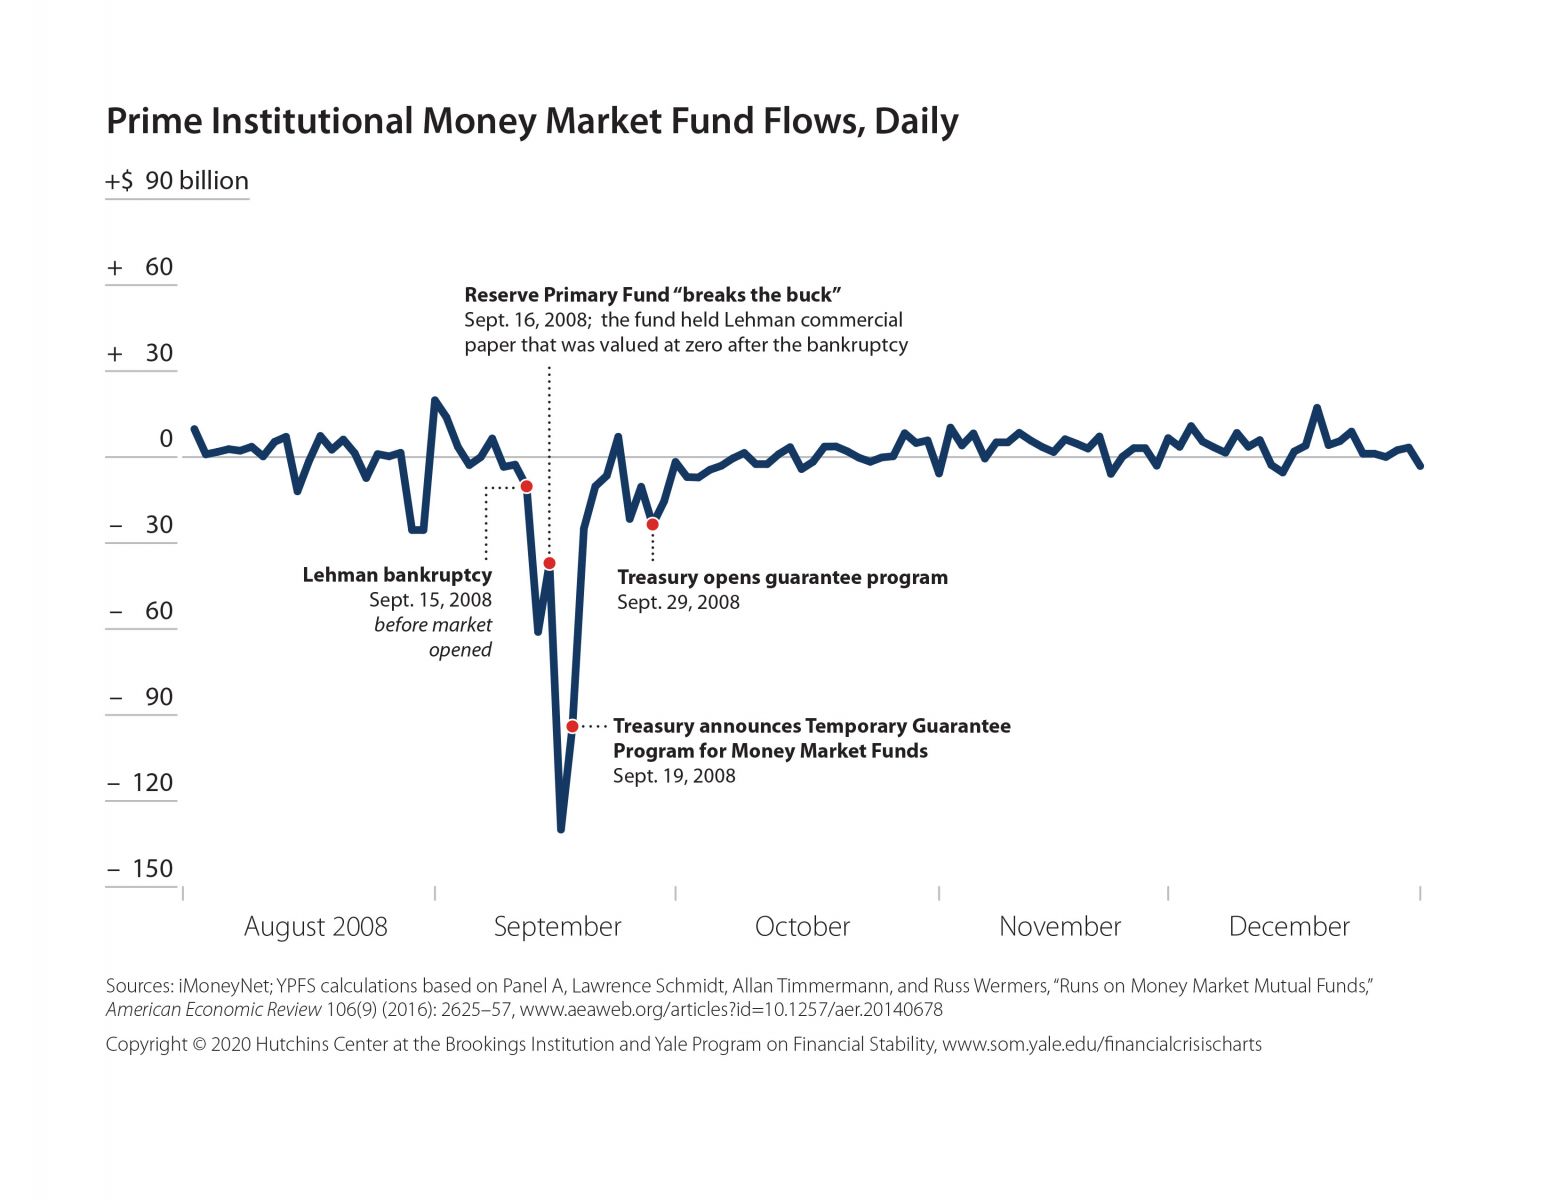
Prime Institutional Money Market Fund Flows, Daily, August–December 2008
Debt Outstanding under the TLGP (DGP), 2008–2012, and Bank CDS Spreads, 2007–2009
%2C%202008%E2%80%932012%2C%20and%20Bank%20CDS%20Spreads%2C%202007%E2%80%932009%20%5Bdouble%20chart%5D.jpg)
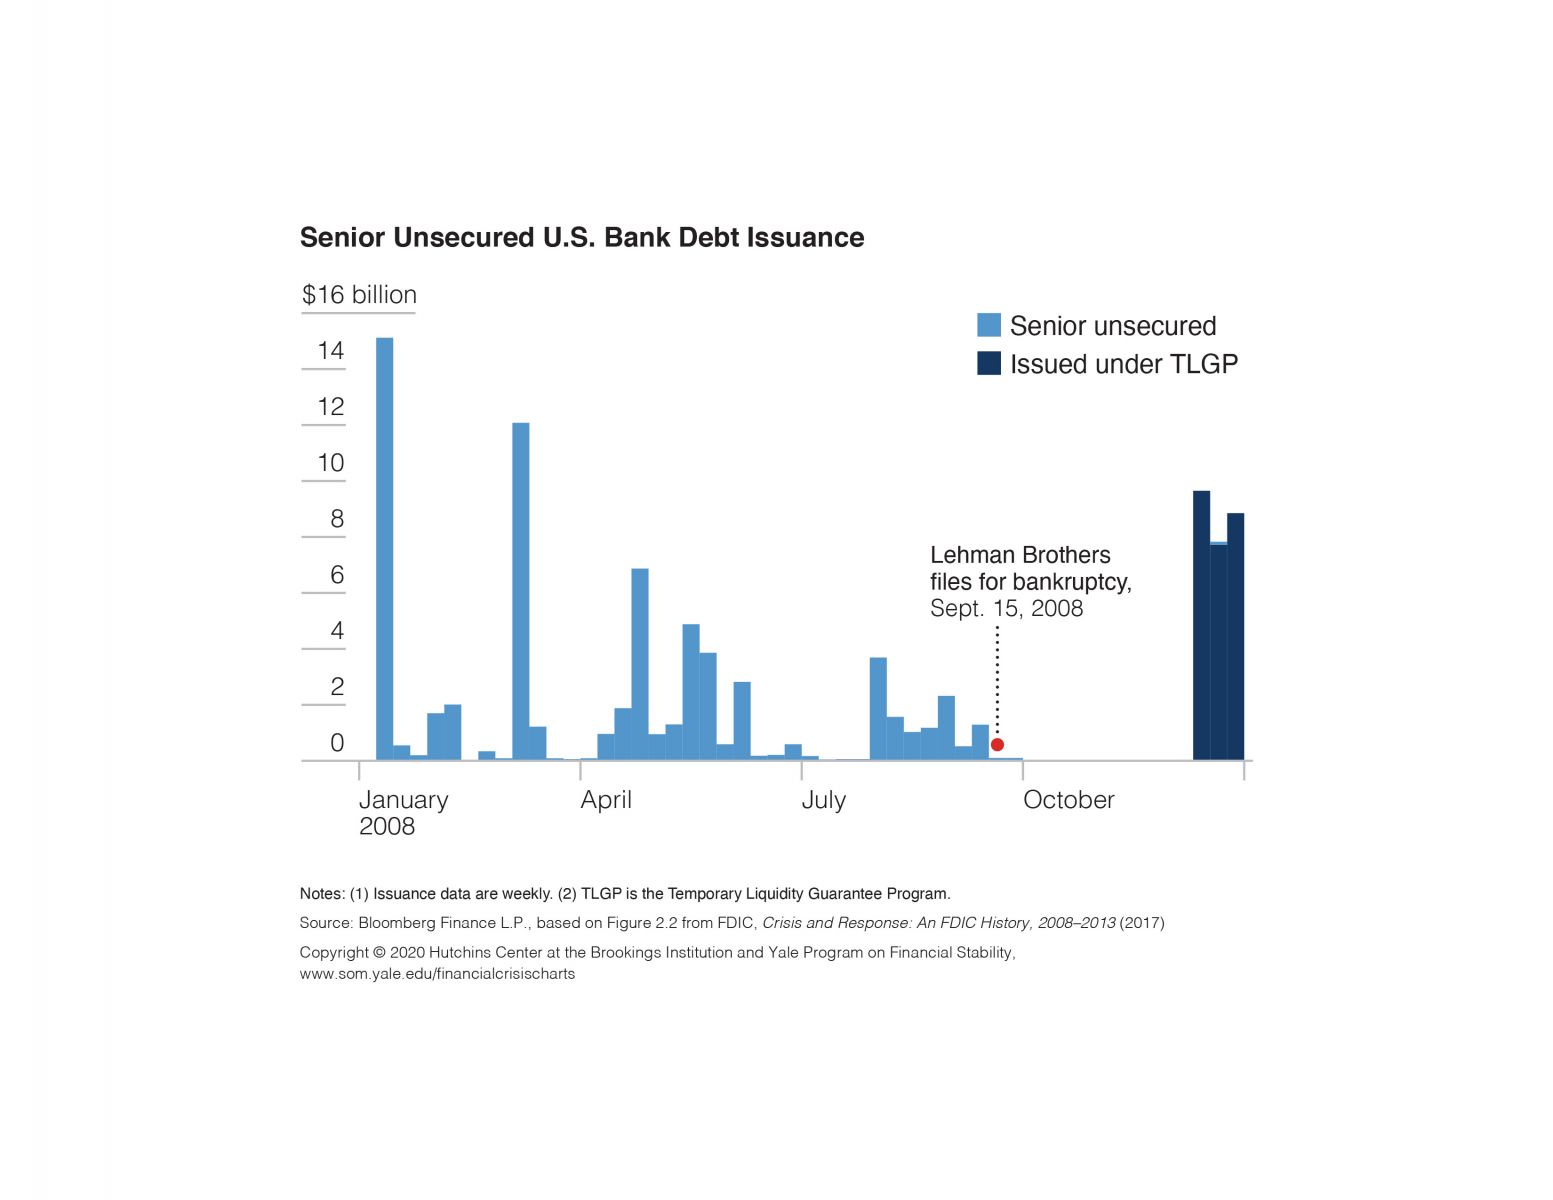
Senior Unsecured U.S. Bank Debt Issuance (in 2008, before and after September)
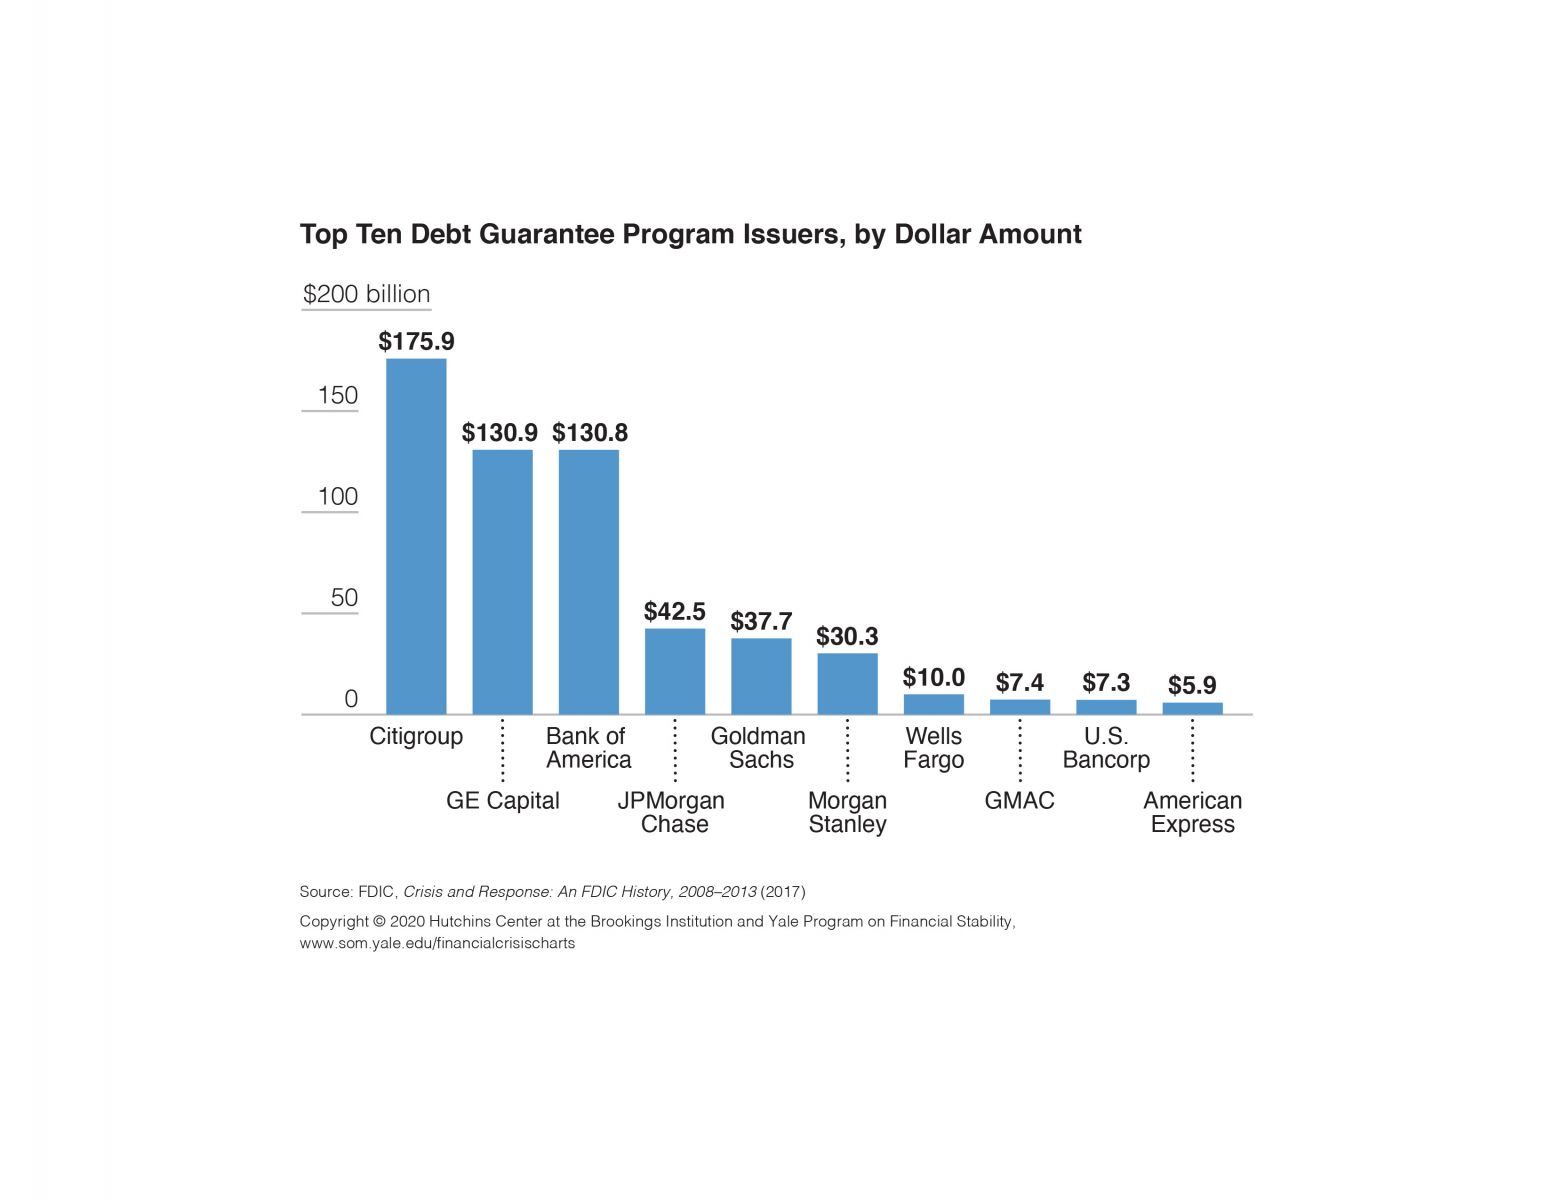
Top Ten Debt Guarantee Program Issuers, by Dollar Amount
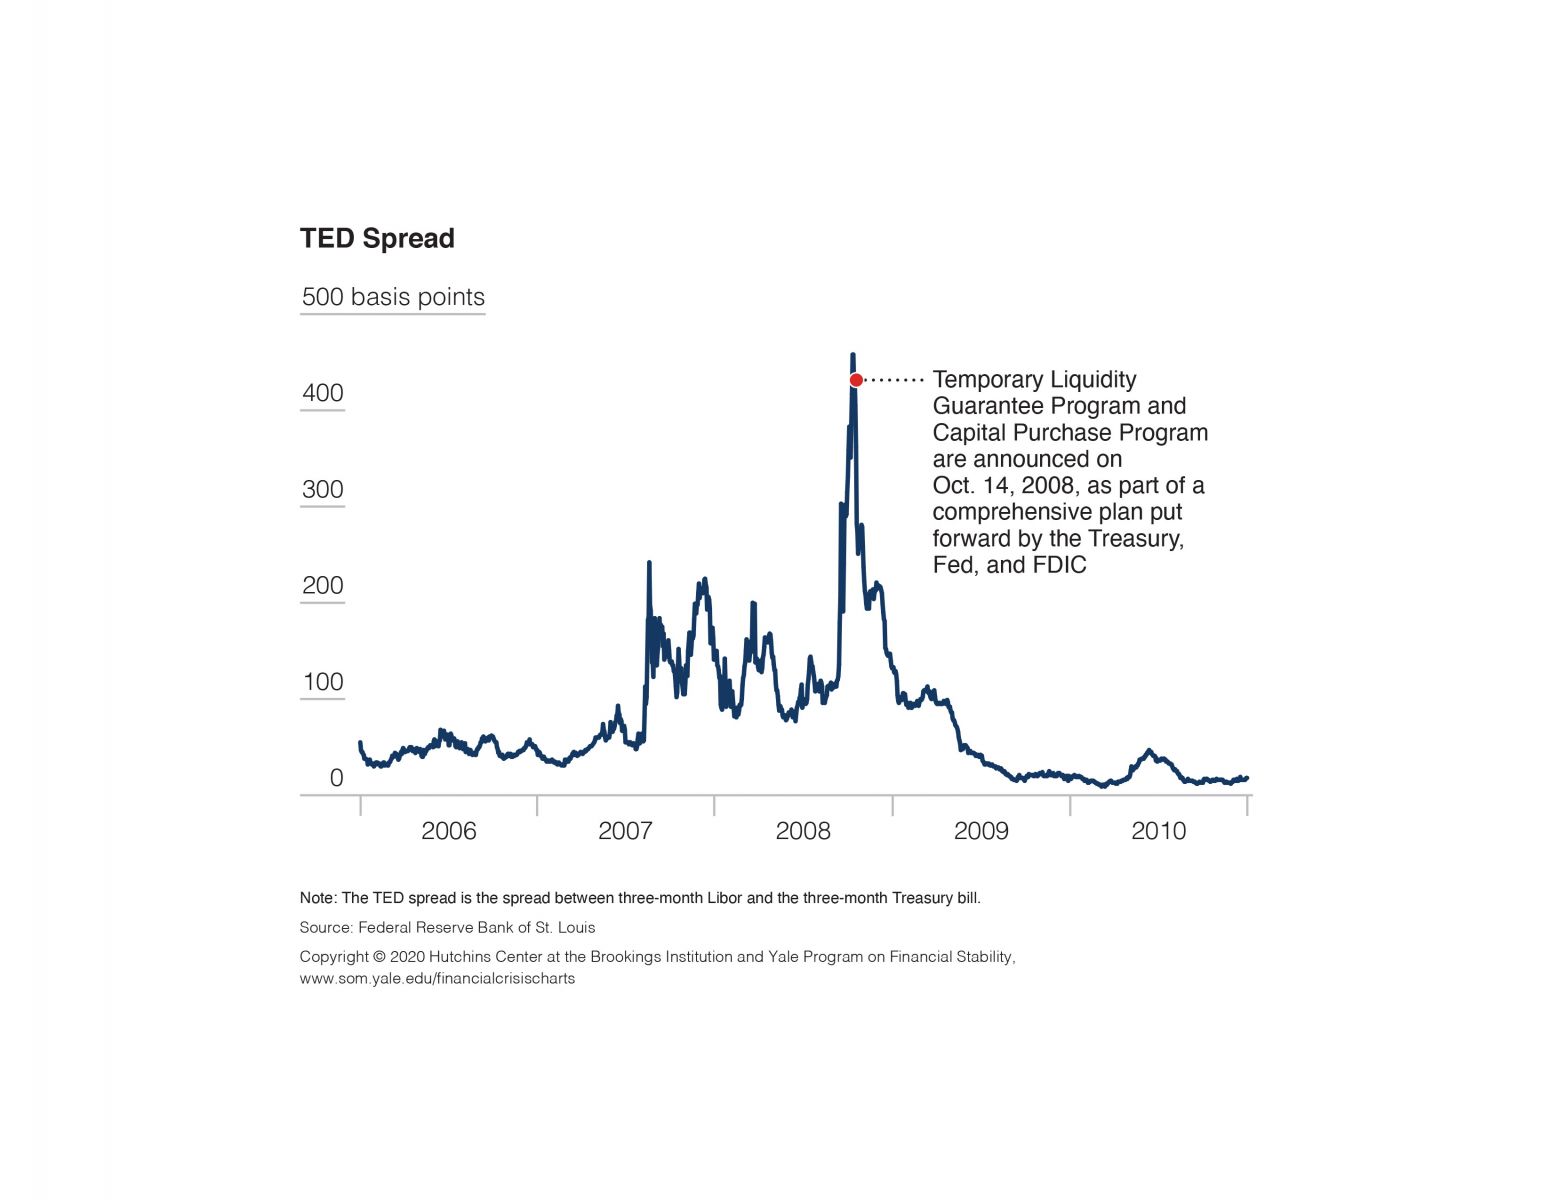
TED Spread, 2006–2010
Banks and Bank Capital
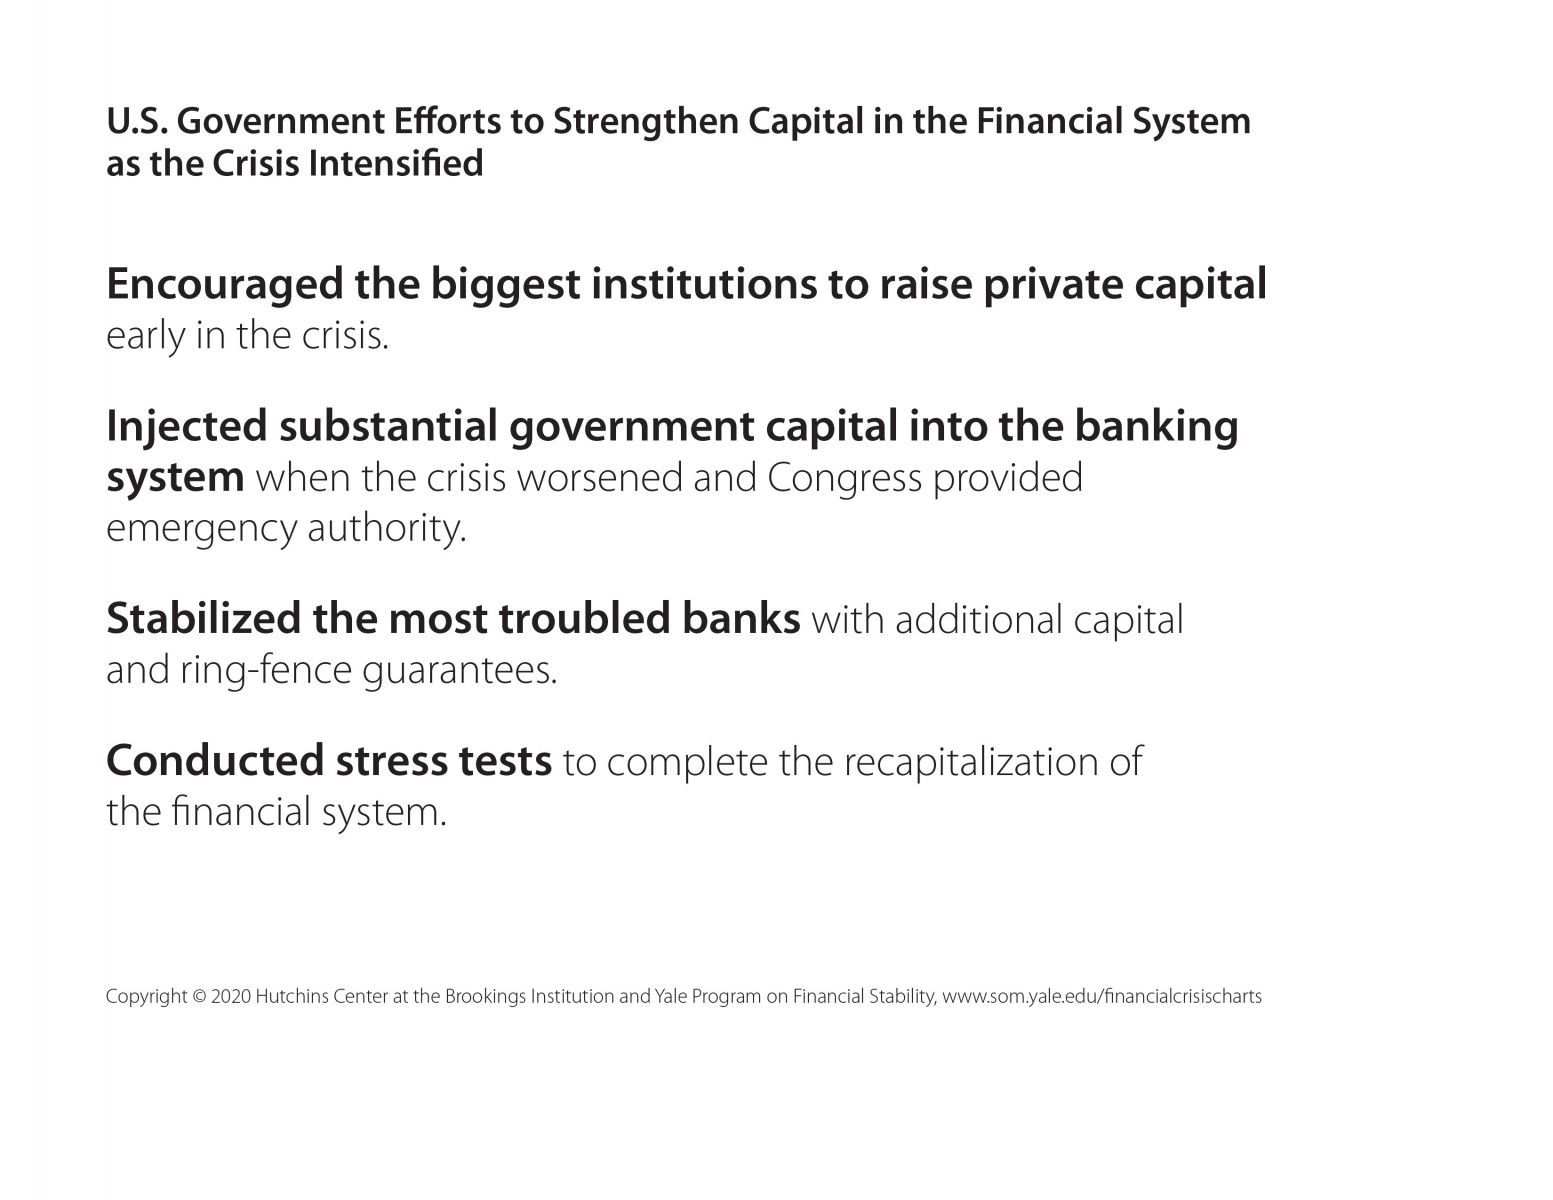
Capital programs title page
Three-Month Libor-OIS Spread and the CPP and TLGP
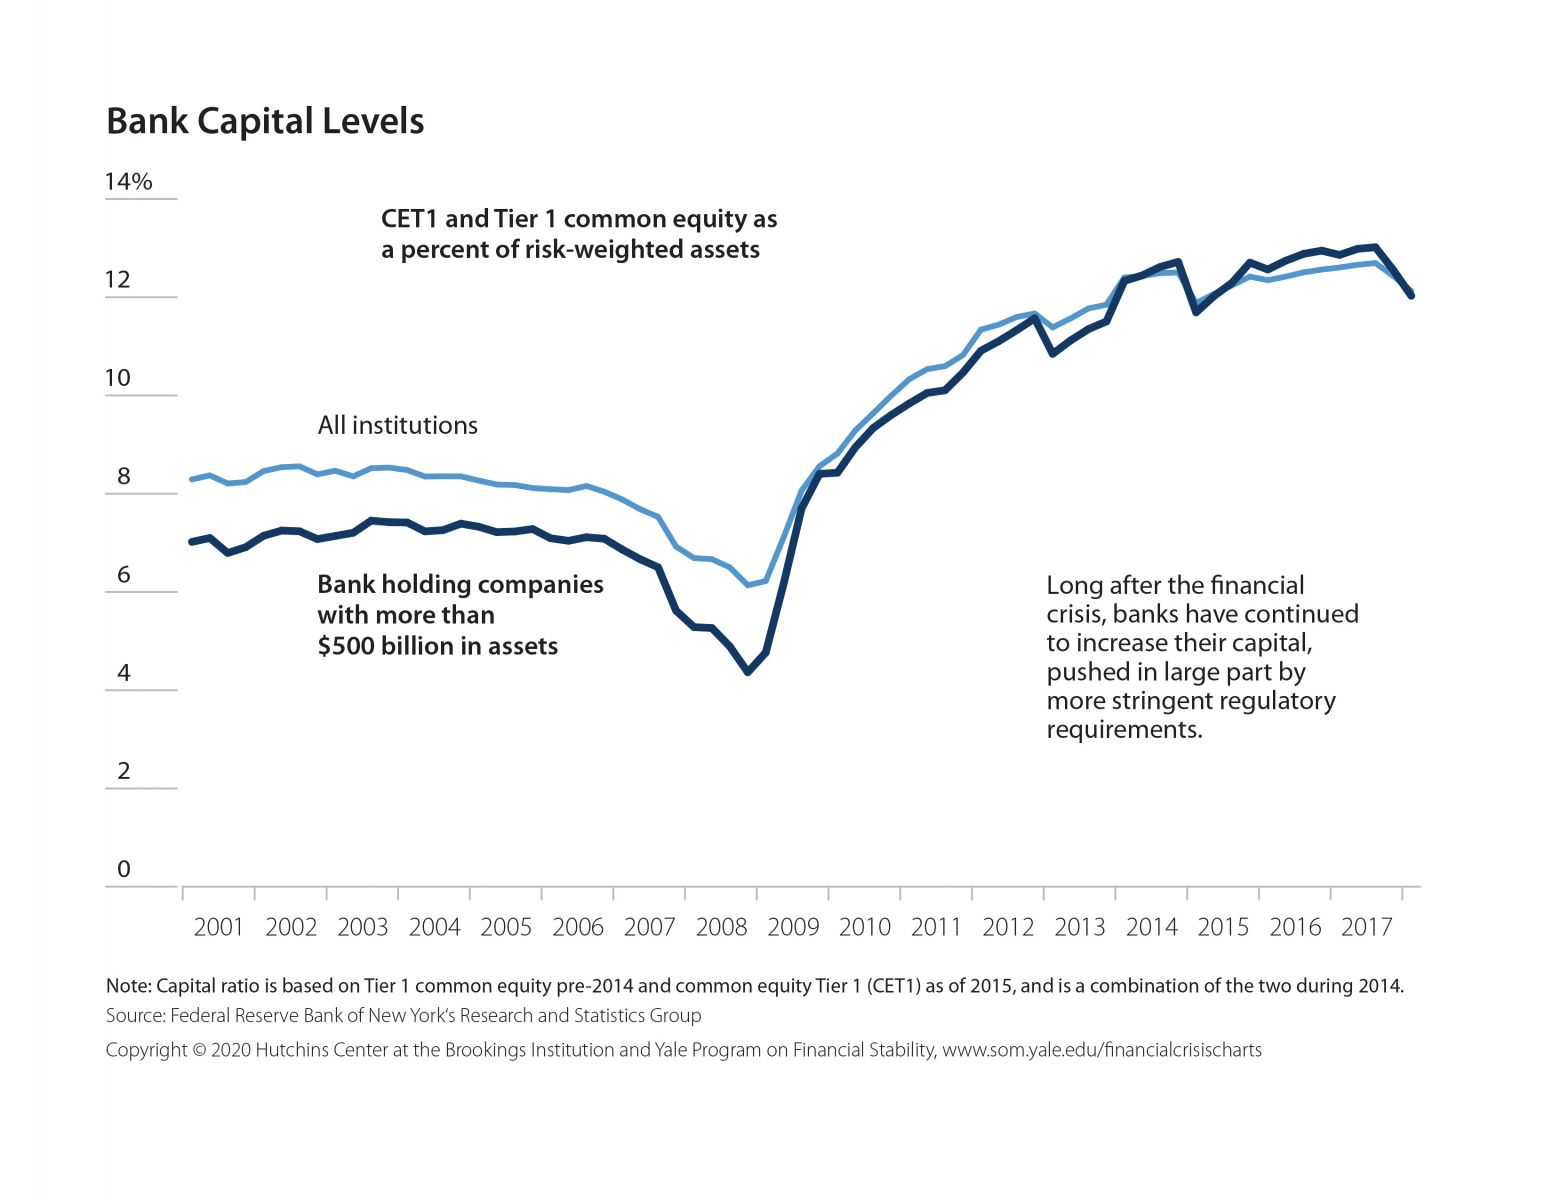
Bank Capital Levels, 2001–2017
Initial CPP Investments in Large U.S. Financial Institutions, Announced October 14, 2008
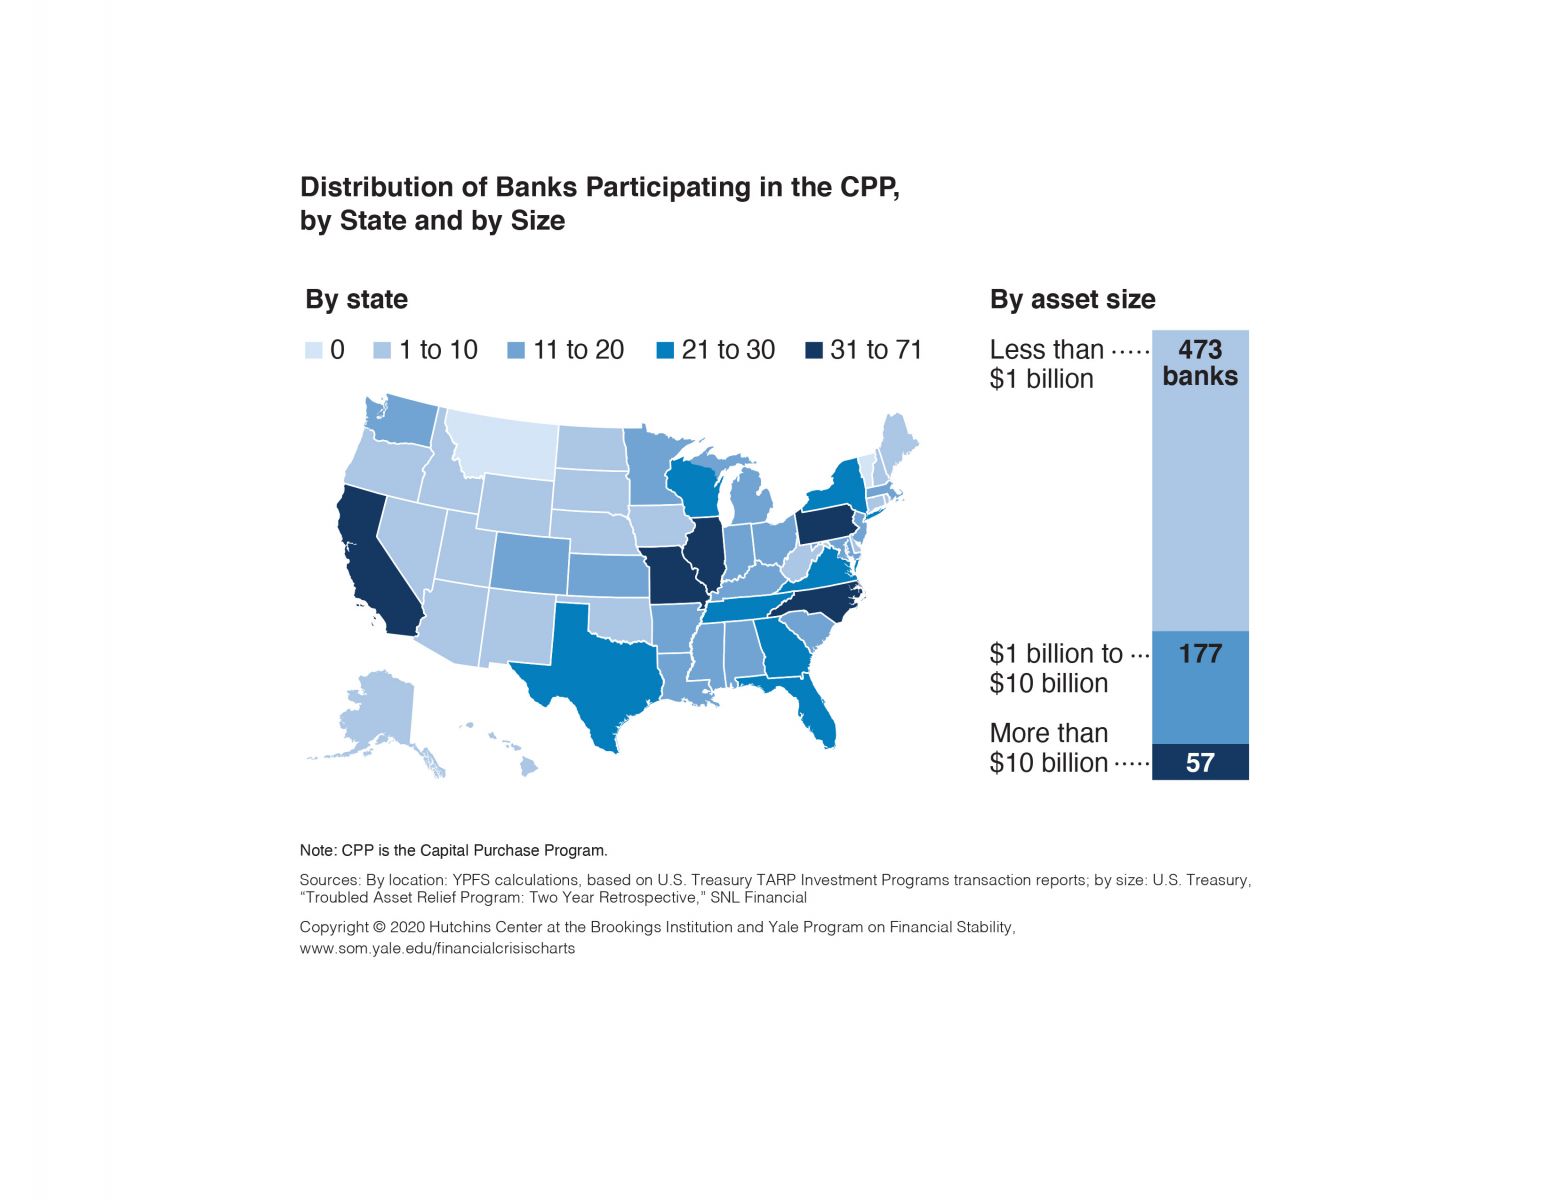
Distribution of Banks Participating in the CPP, by State and by Size
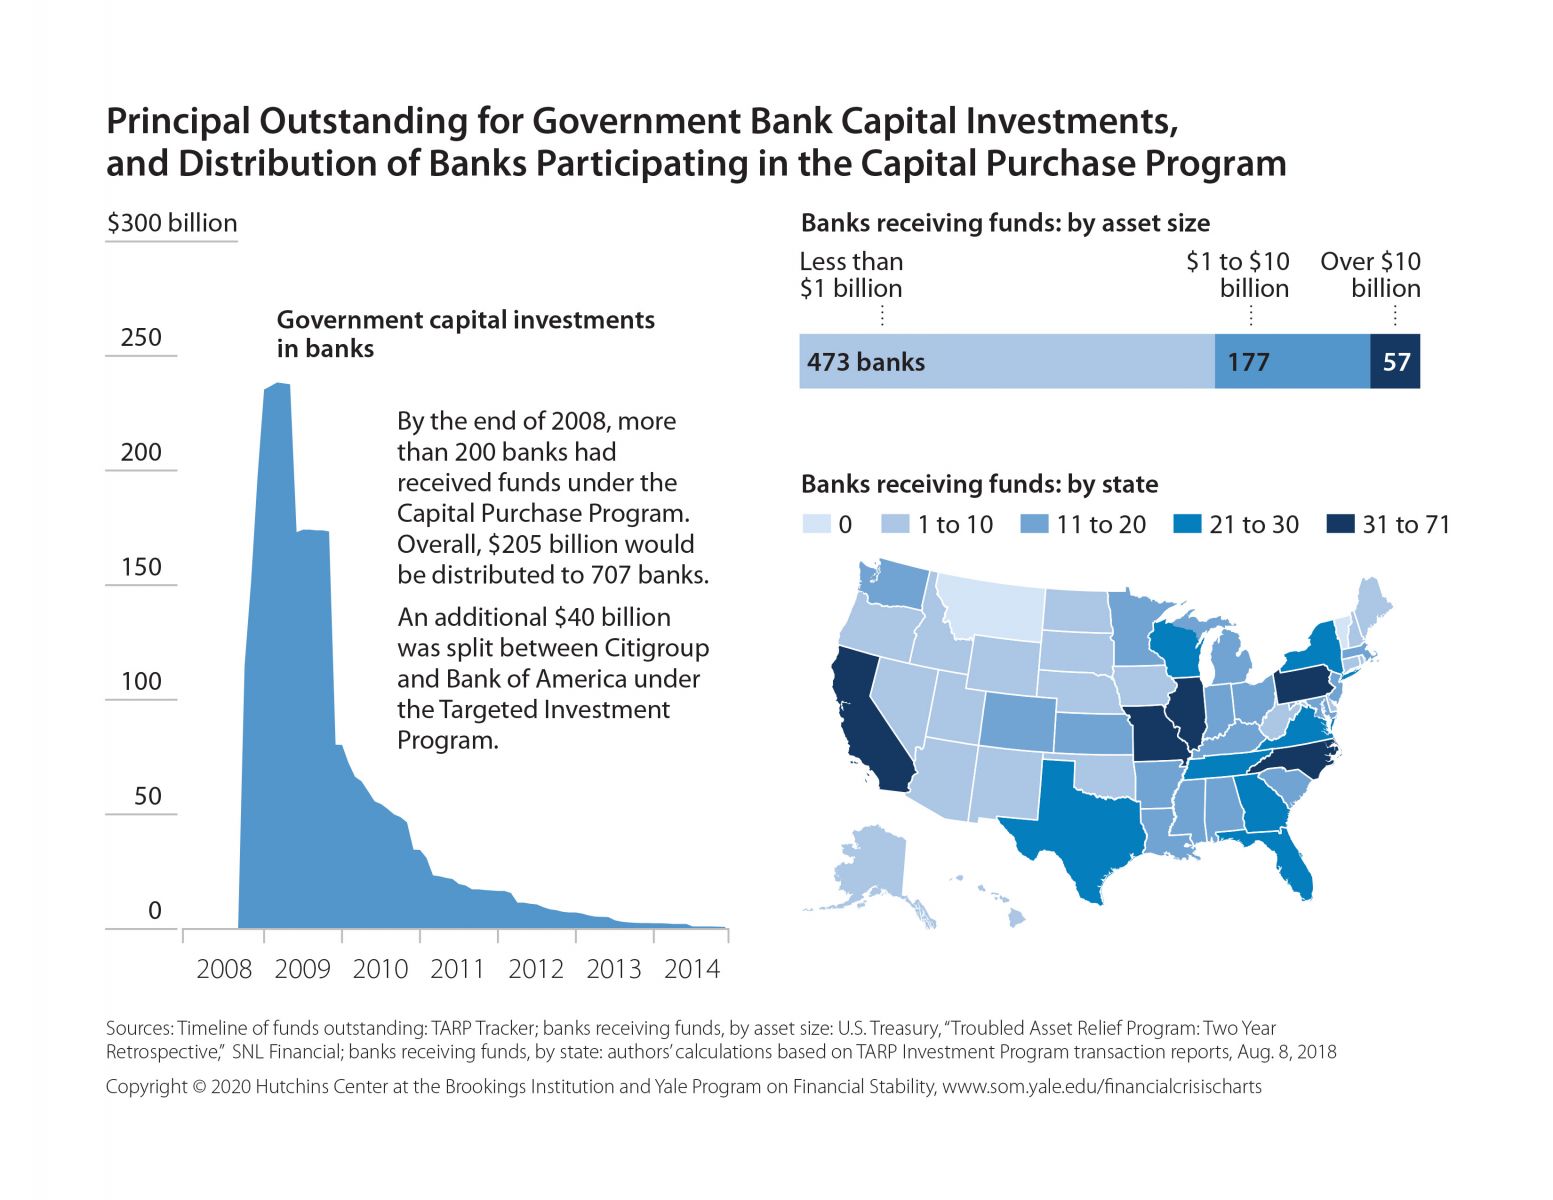
Principal Outstanding for Government Bank Capital Investments, 2008–2014, and Distribution of Banks Participating in the Capital Purchase Program, by Asset Size and by Location
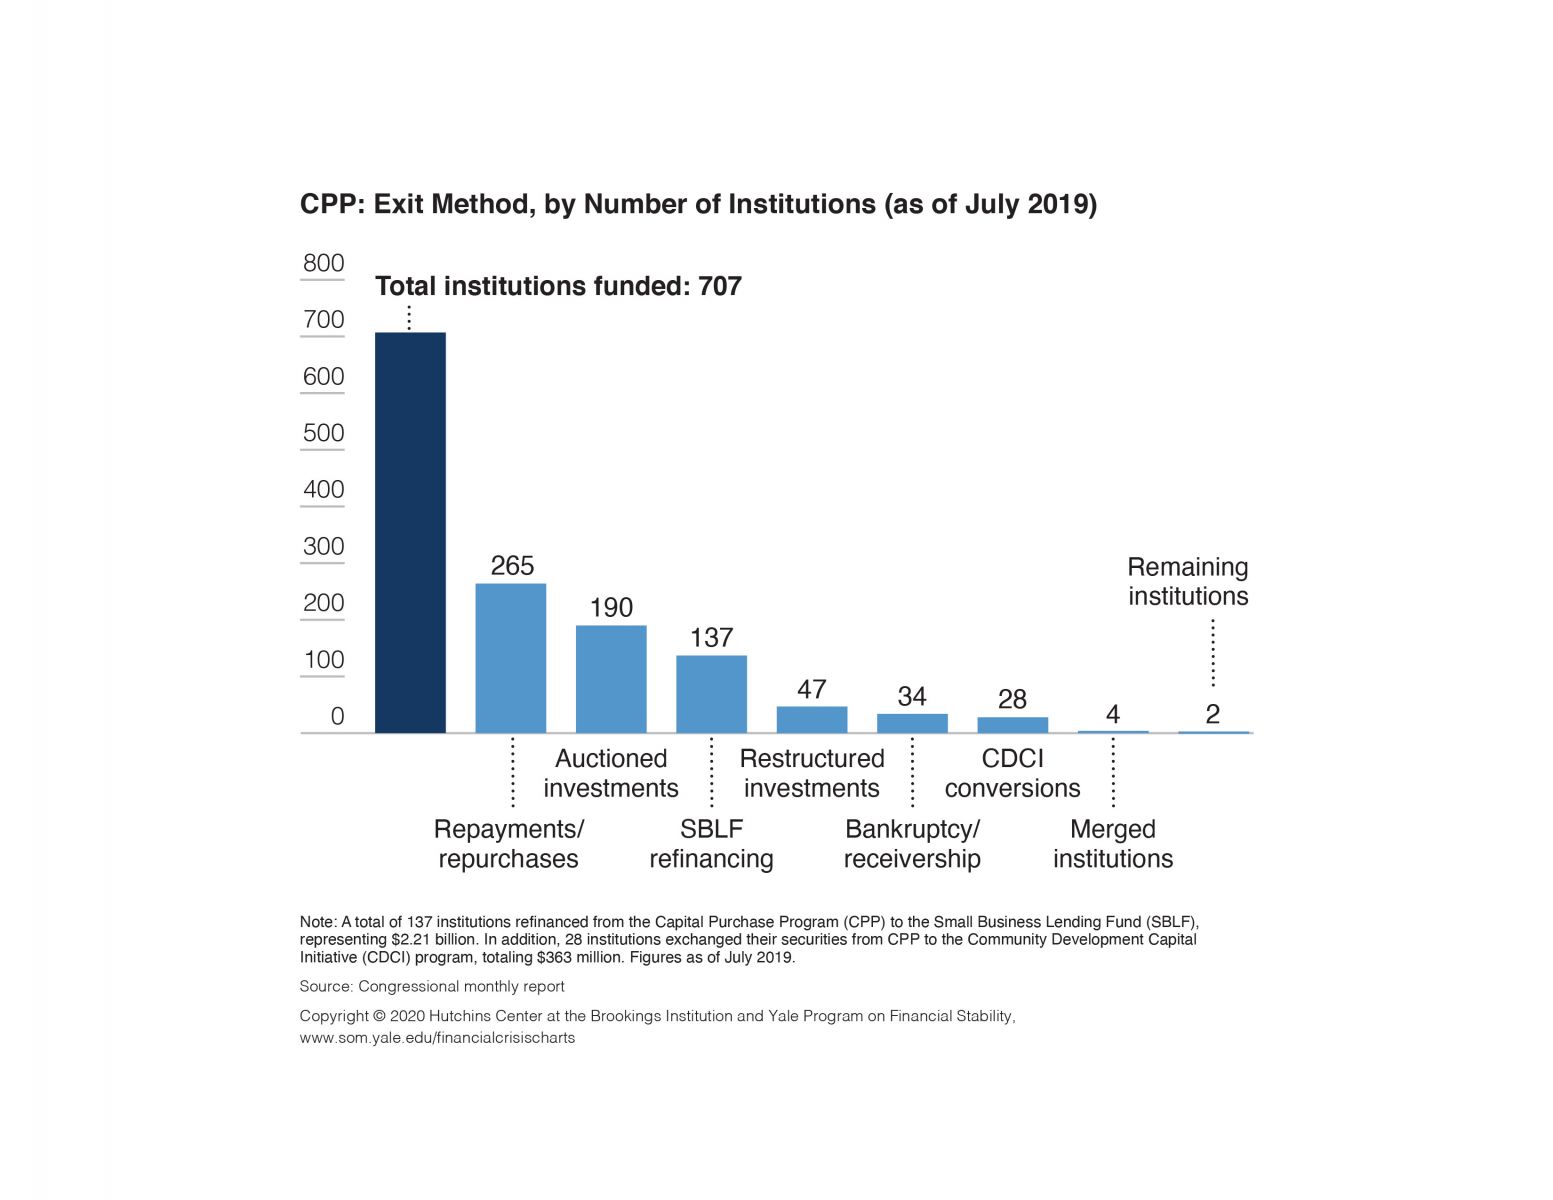
CPP: Exit Method, by Number of Institutions (as of July 2019)
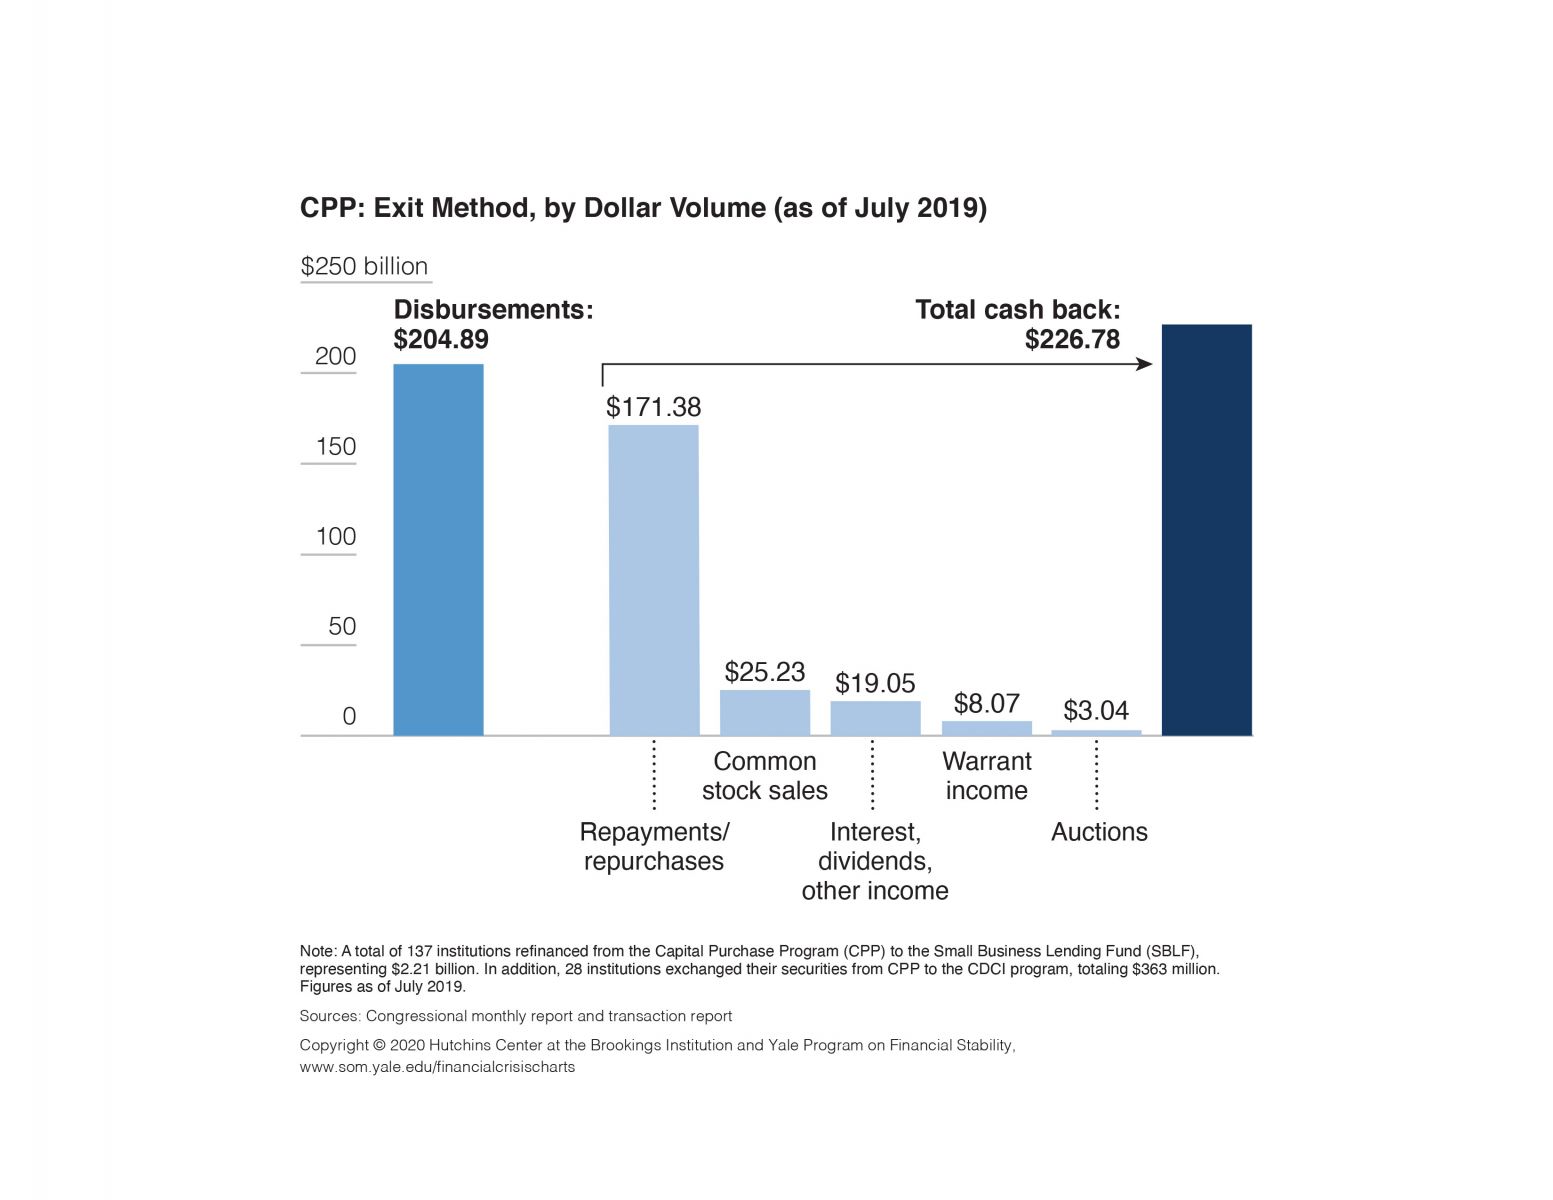
CPP: Exit Method, by Dollar Volume (as of July 2019)
Bank Stress Tests, Bank CDS Spreads, and Three-Month Libor-OIS Spread, 2007–2010
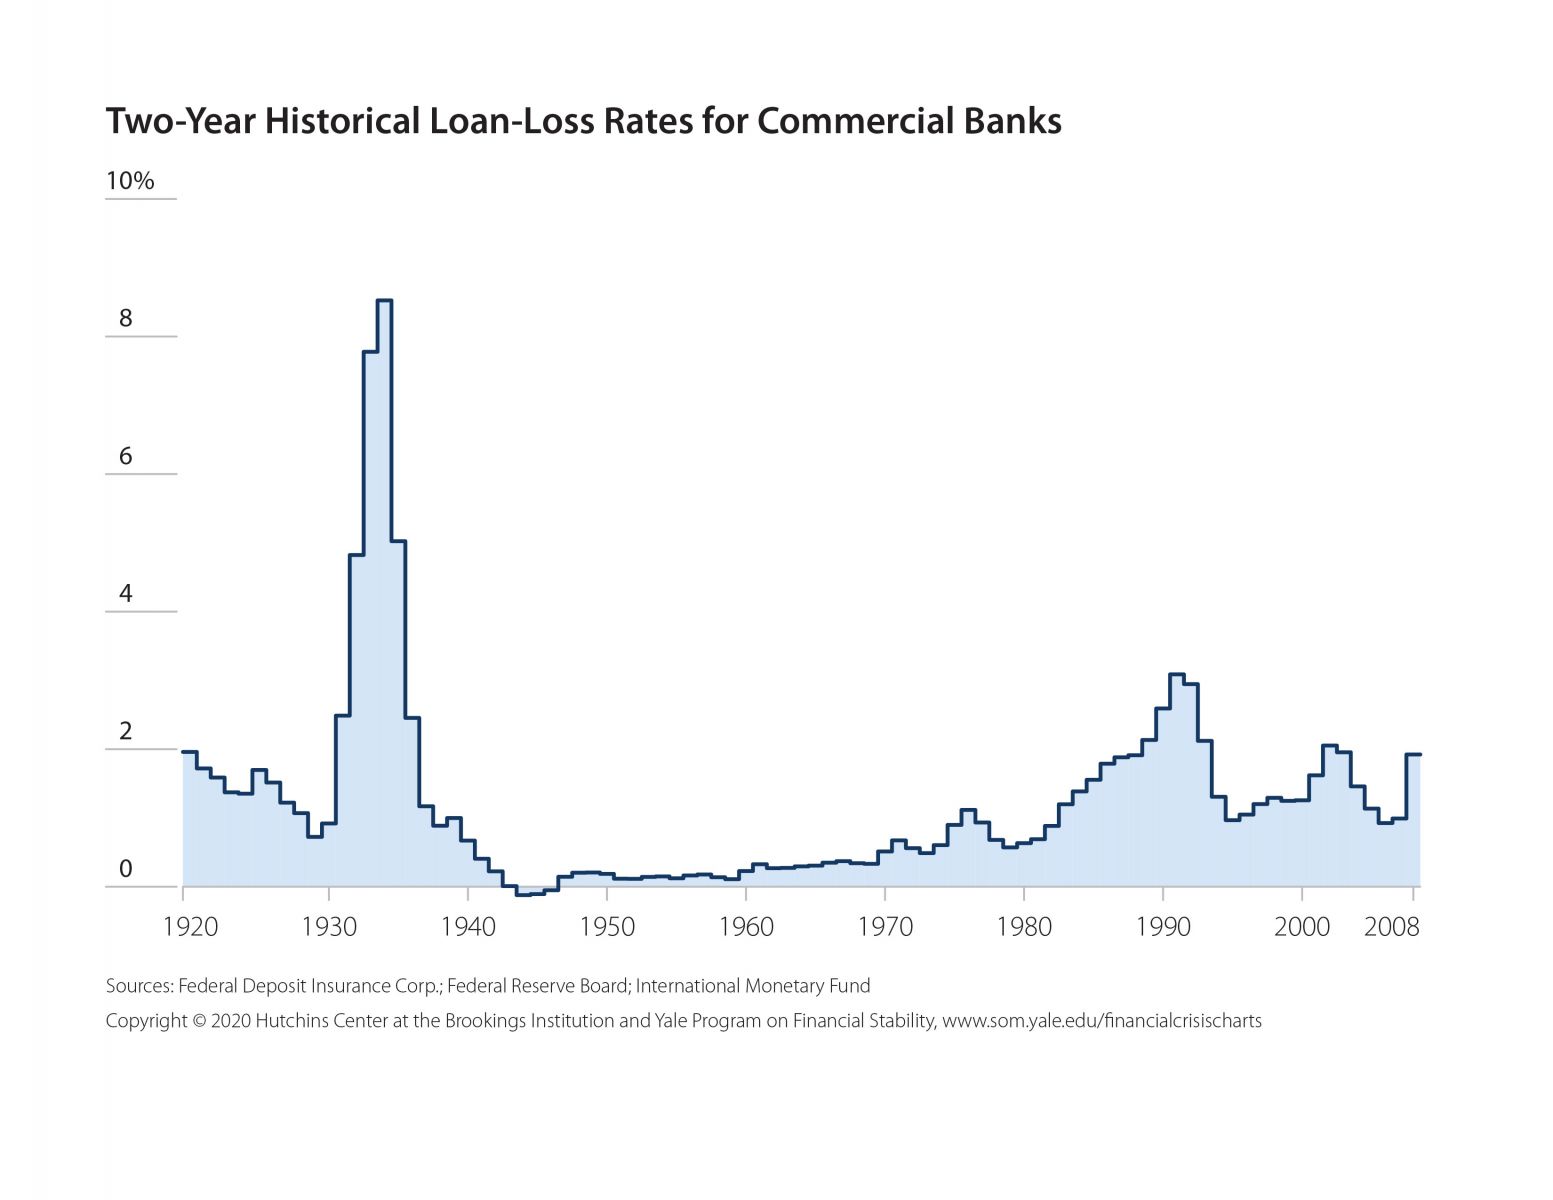
Two-Year Historical Loan-Loss Rates for Commercial Banks, 1920–2008
Historical Loan-Loss Rates and Bank Stress Tests, 1920-2012
Two-Year Historical Loan-Loss Rates for Commercial Banks, 1920–2012, and Bank Capital Shortfalls As Determined by the Supervisory Capital Assessment Program, May 7, 2009
Stress Test Results: Capital Raises Needed, May 7, 2009
Private Capital Raised January 1, 2007–October 13, 2008, by the Nine Financial Institutions Receiving Initial Government Investments
Government and Private Capital Raised October 14, 2008–May 6, 2009, by the Nine Financial Institutions Receiving Initial Government Investments
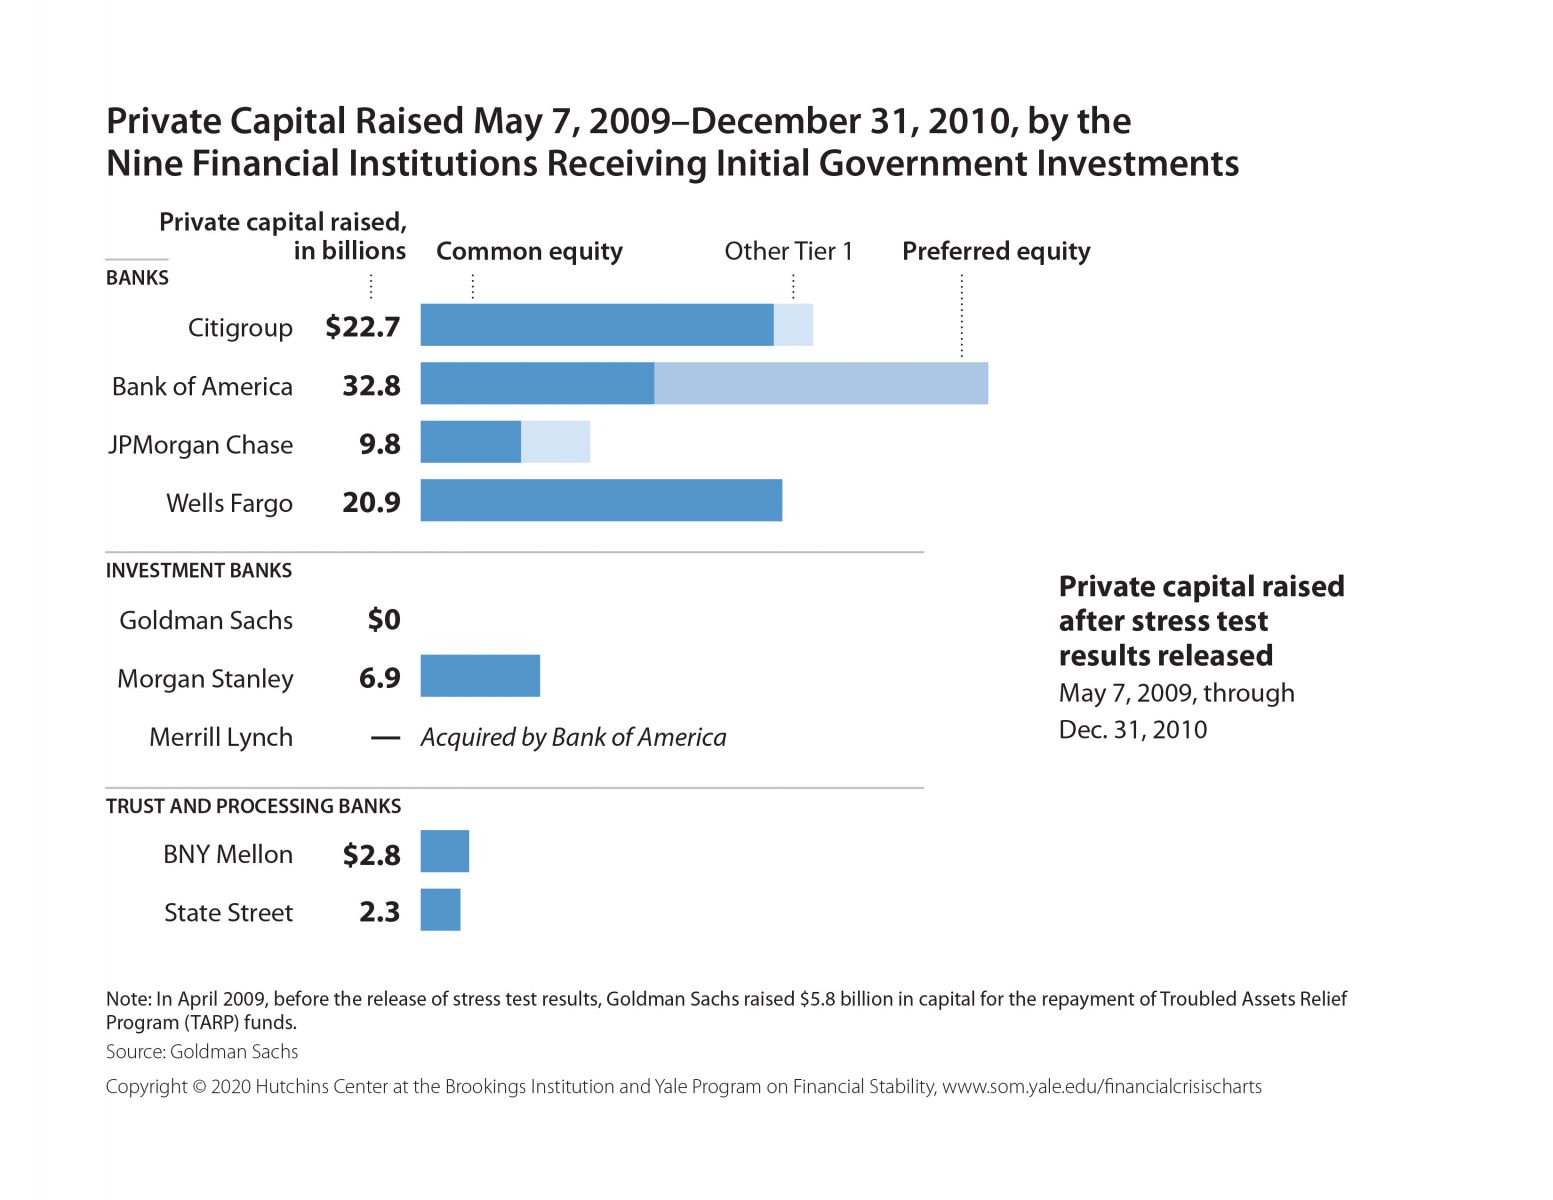
Private Capital Raised May 7, 2009–December 31, 2010, by the Nine Financial Institutions Receiving Initial Government Investments
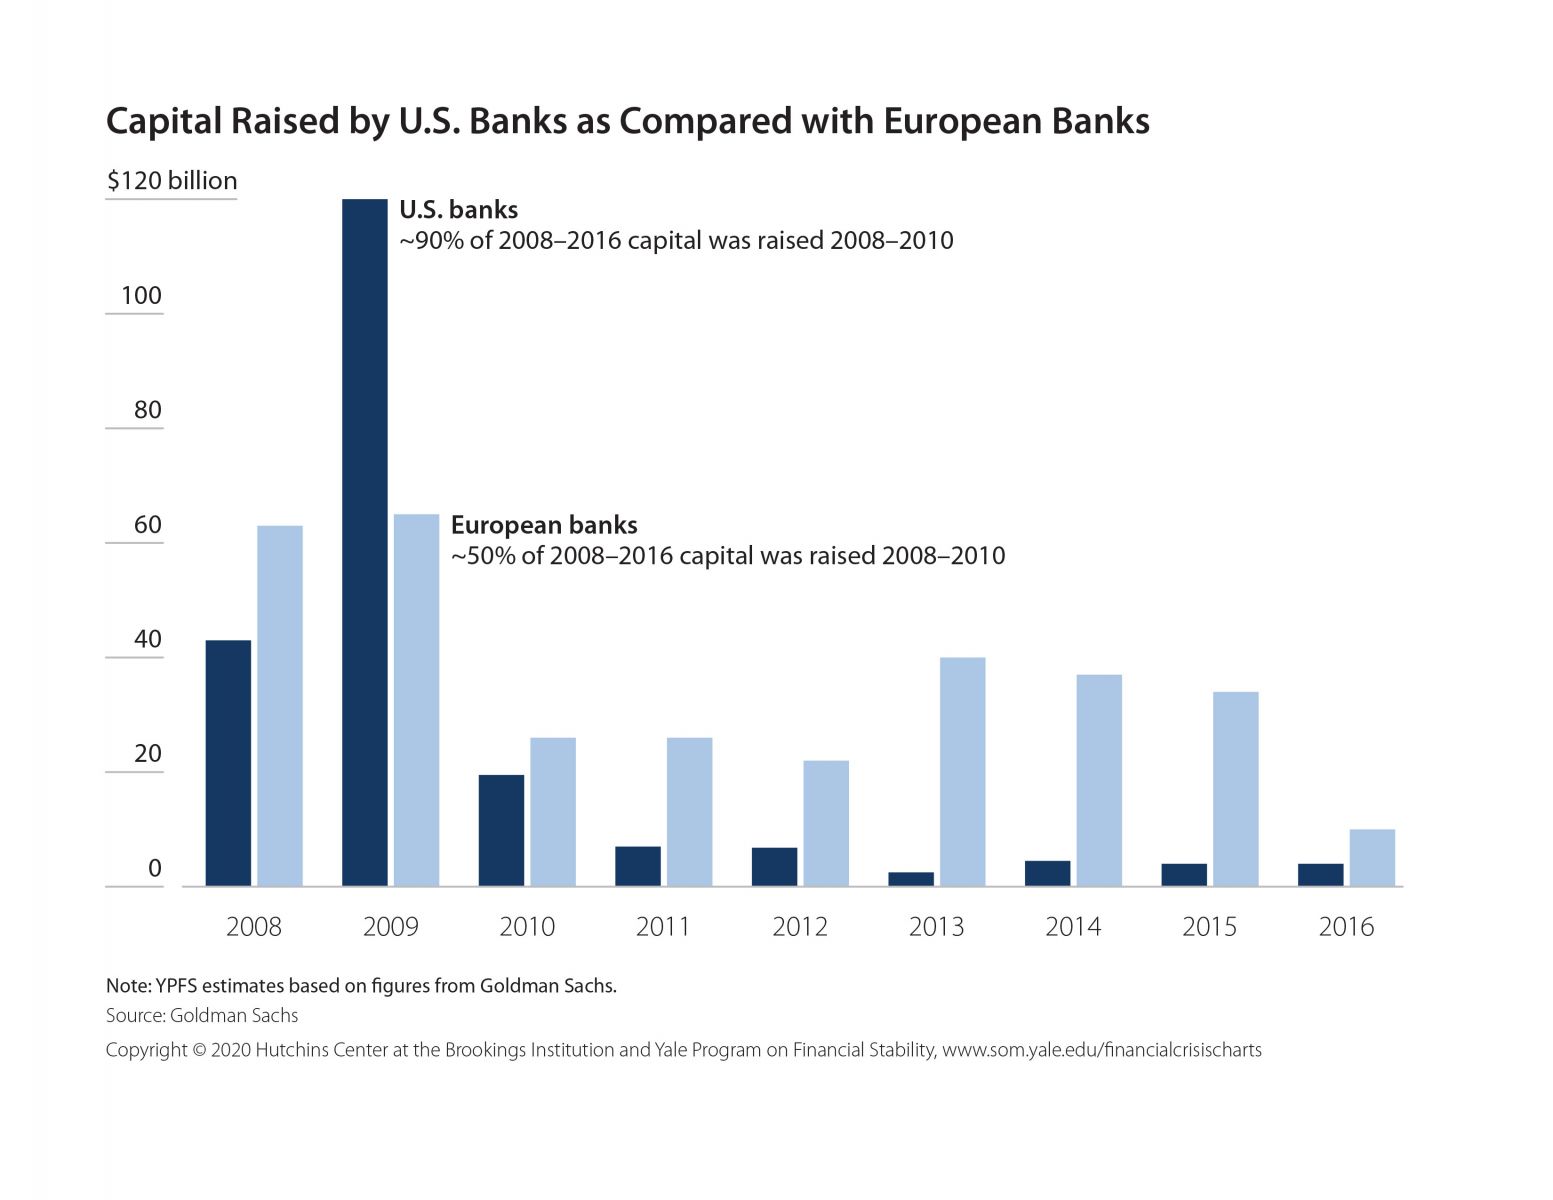
Capital Raised by U.S. Banks as Compared with European Banks, 2008–2016
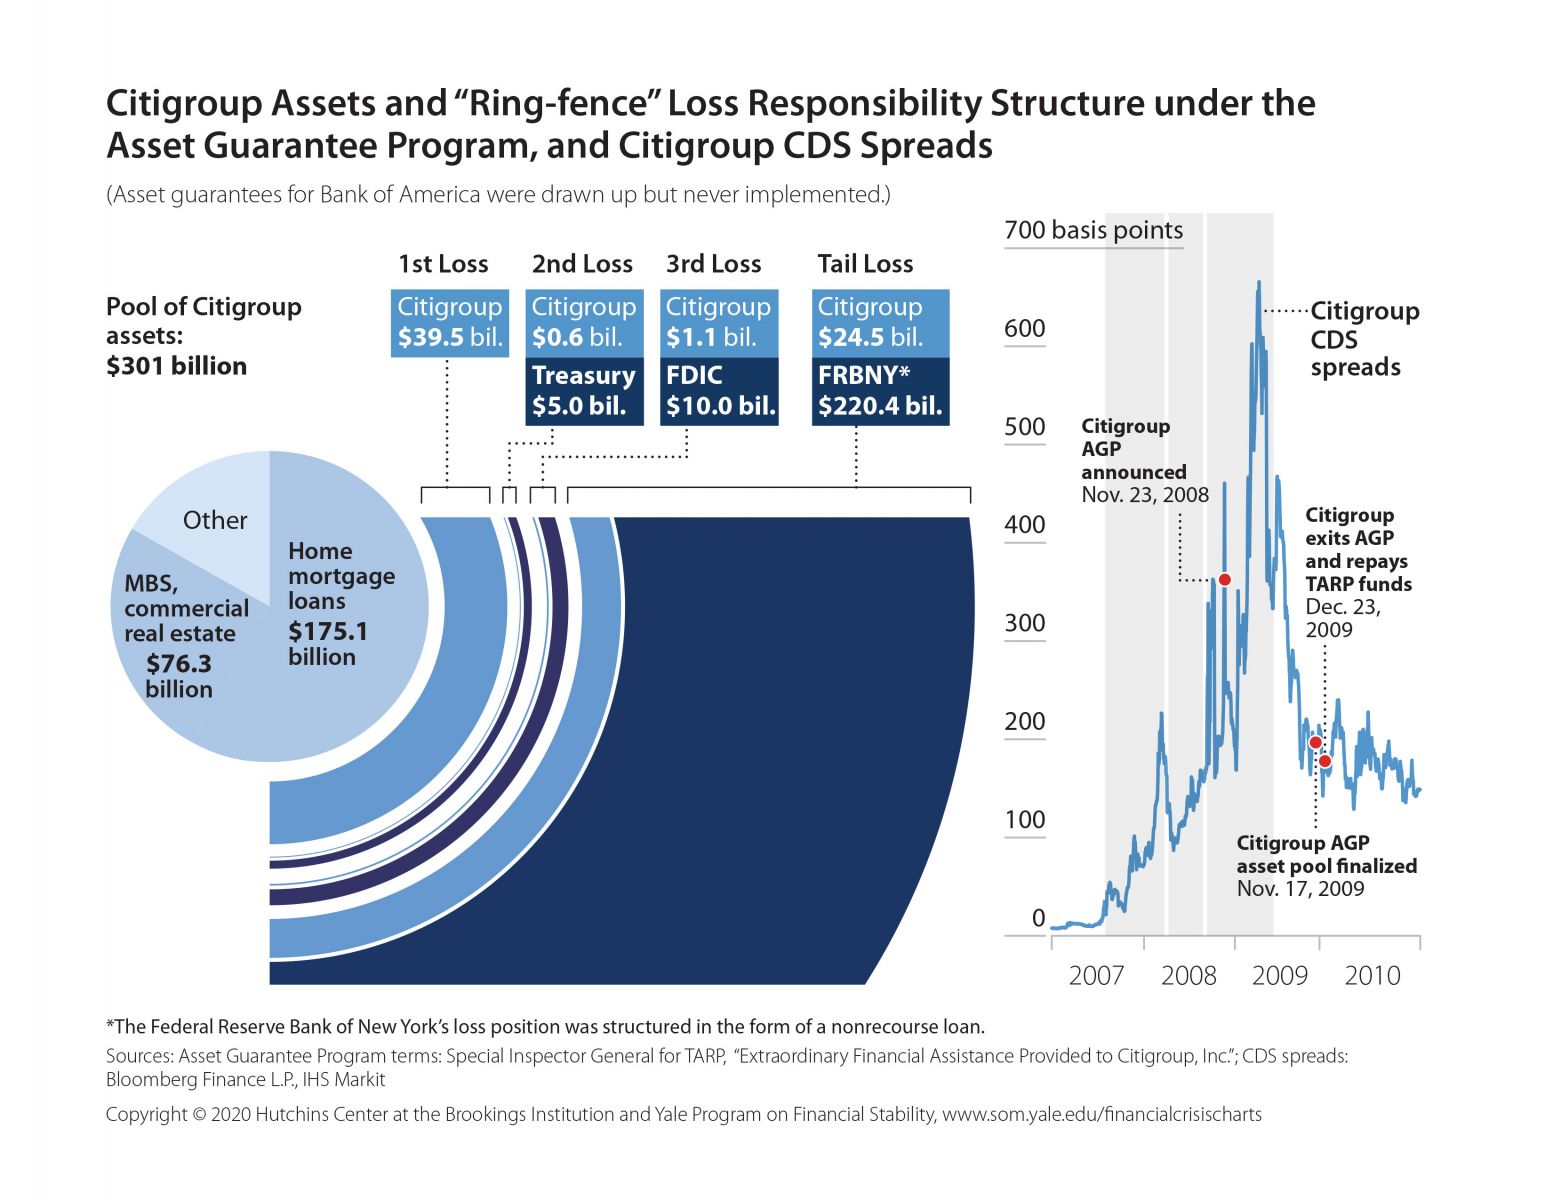
Citigroup Assets and “Ring-fence” Loss Responsibility Structure under the Asset Guarantee Program, and Citigroup CDS Spreads, 2007–2010
Government Commitment to AIG and Selected Events, 2008–2012
Share of Total Deposits Insured by the FDIC and Changes in Coverage, 2007–2012
Problem U.S. Banks and Problem U.S. Bank Assets, 2006–2013
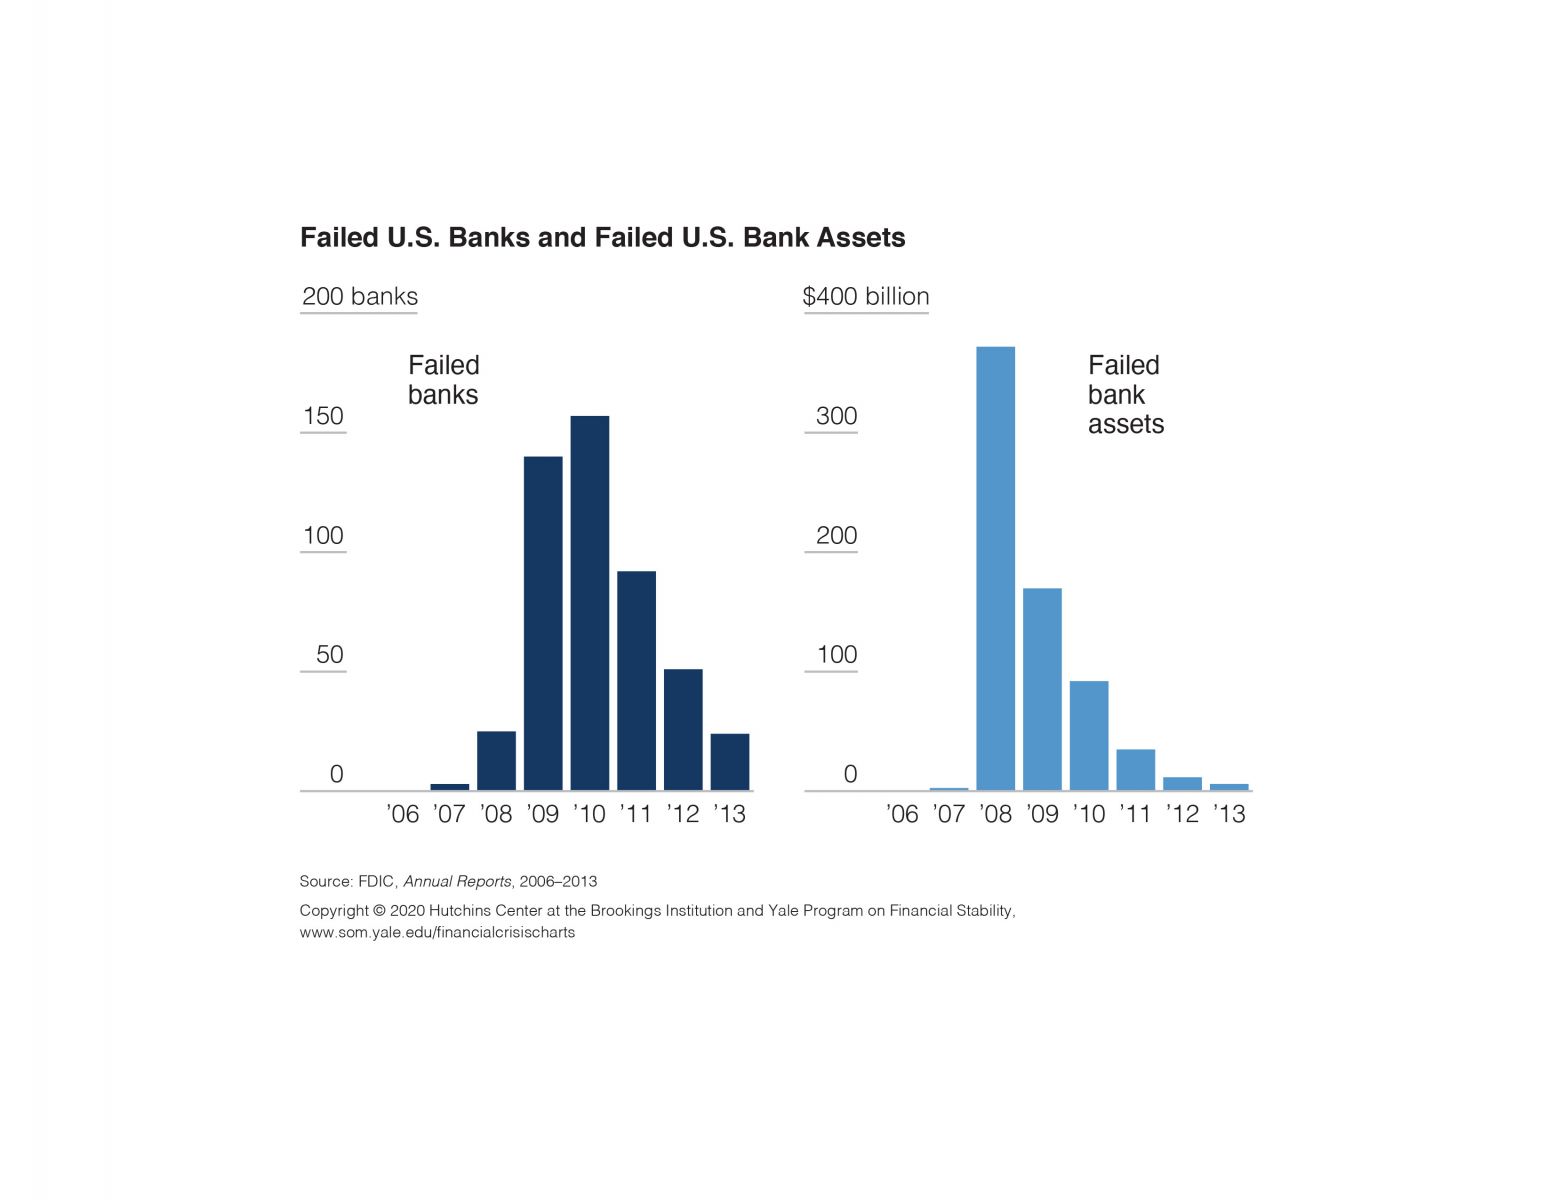
Failed U.S. Banks and Failed U.S. Bank Assets, 2006–2013
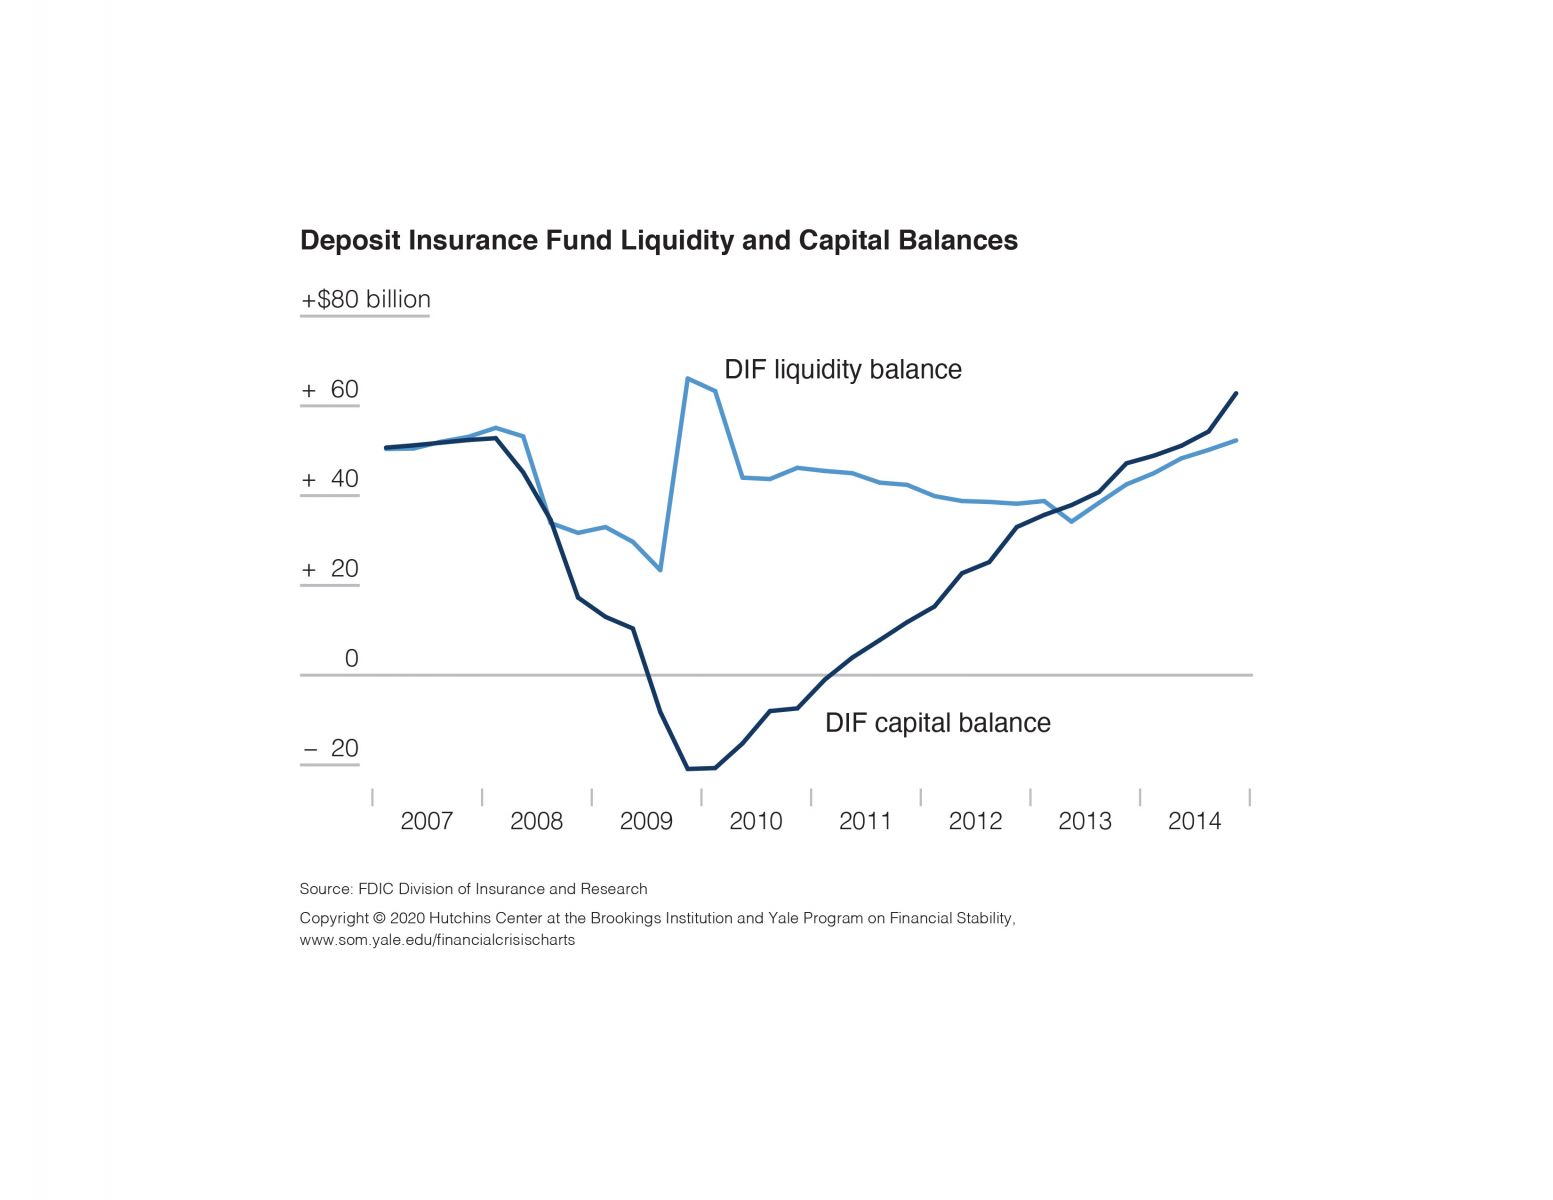
Deposit Insurance Fund Liquidity and Capital Balances, 2007–2014
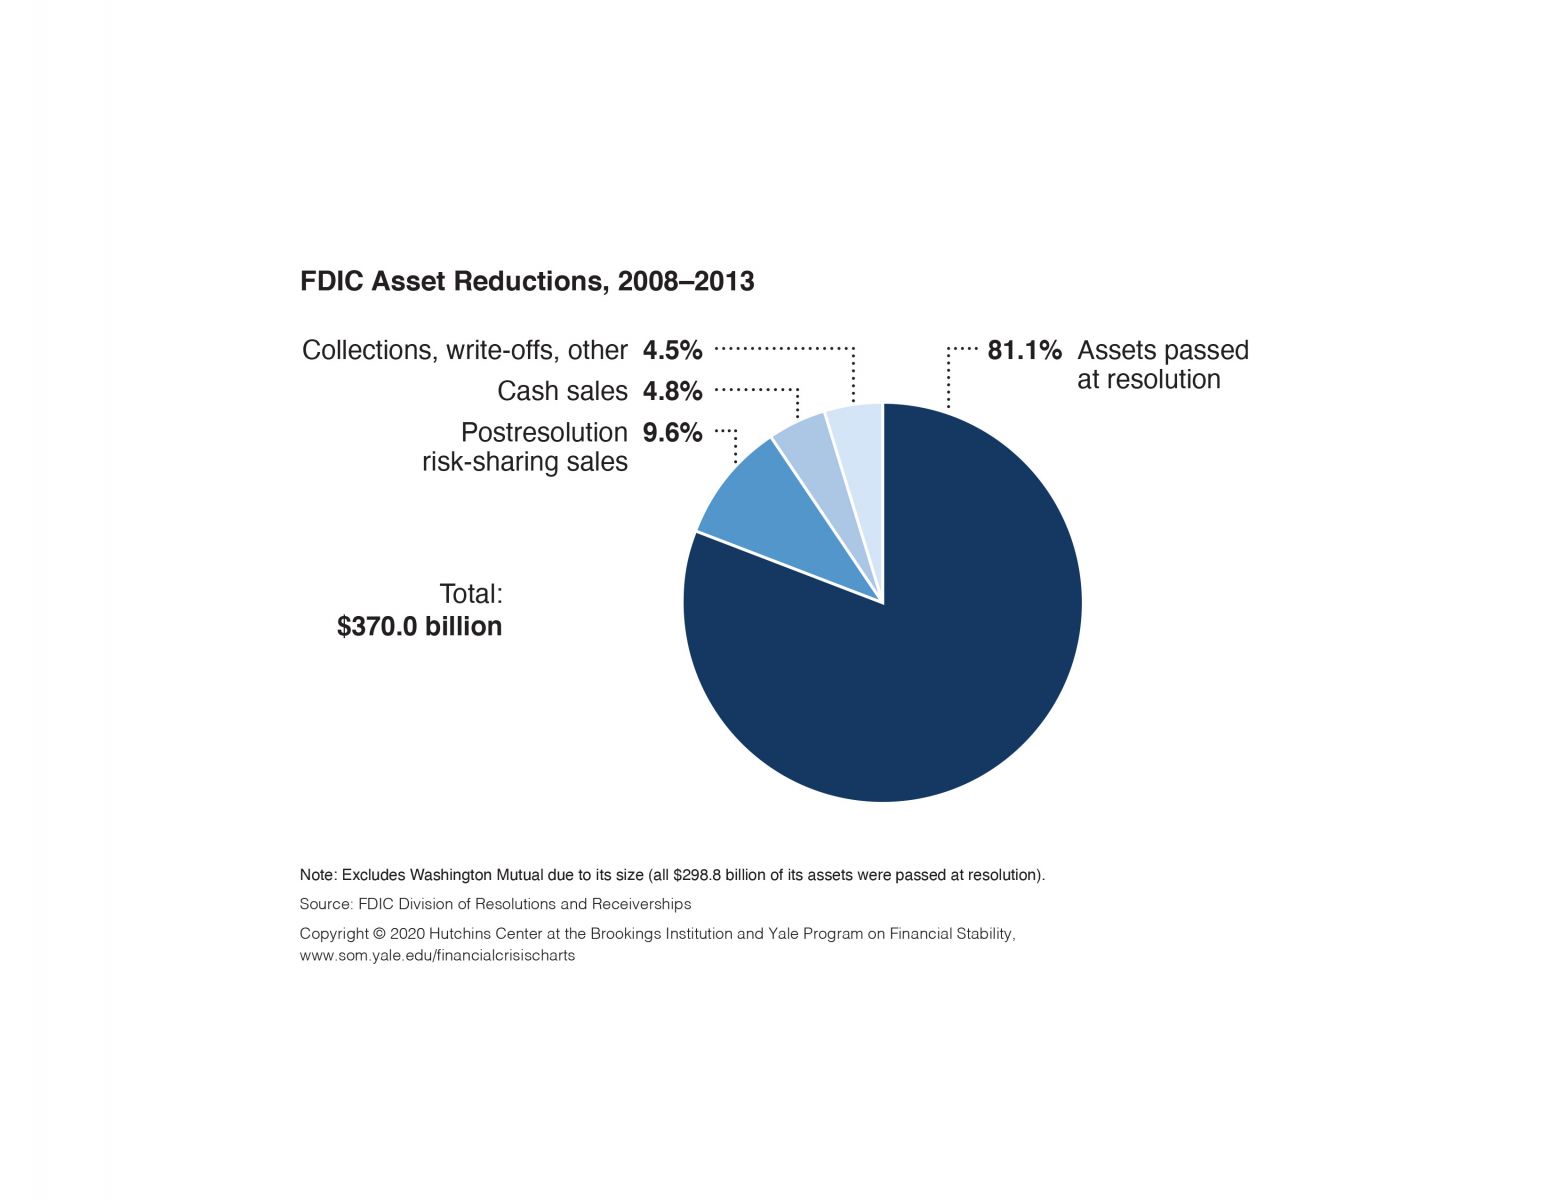
FDIC Asset Reductions, 2008–2013
Resolution Trust Corporation Asset Reductions, 1989–1995
Administration of TARP
Staffing History (Full-Time Equivalents): Office of Financial Stability, 2009–2017
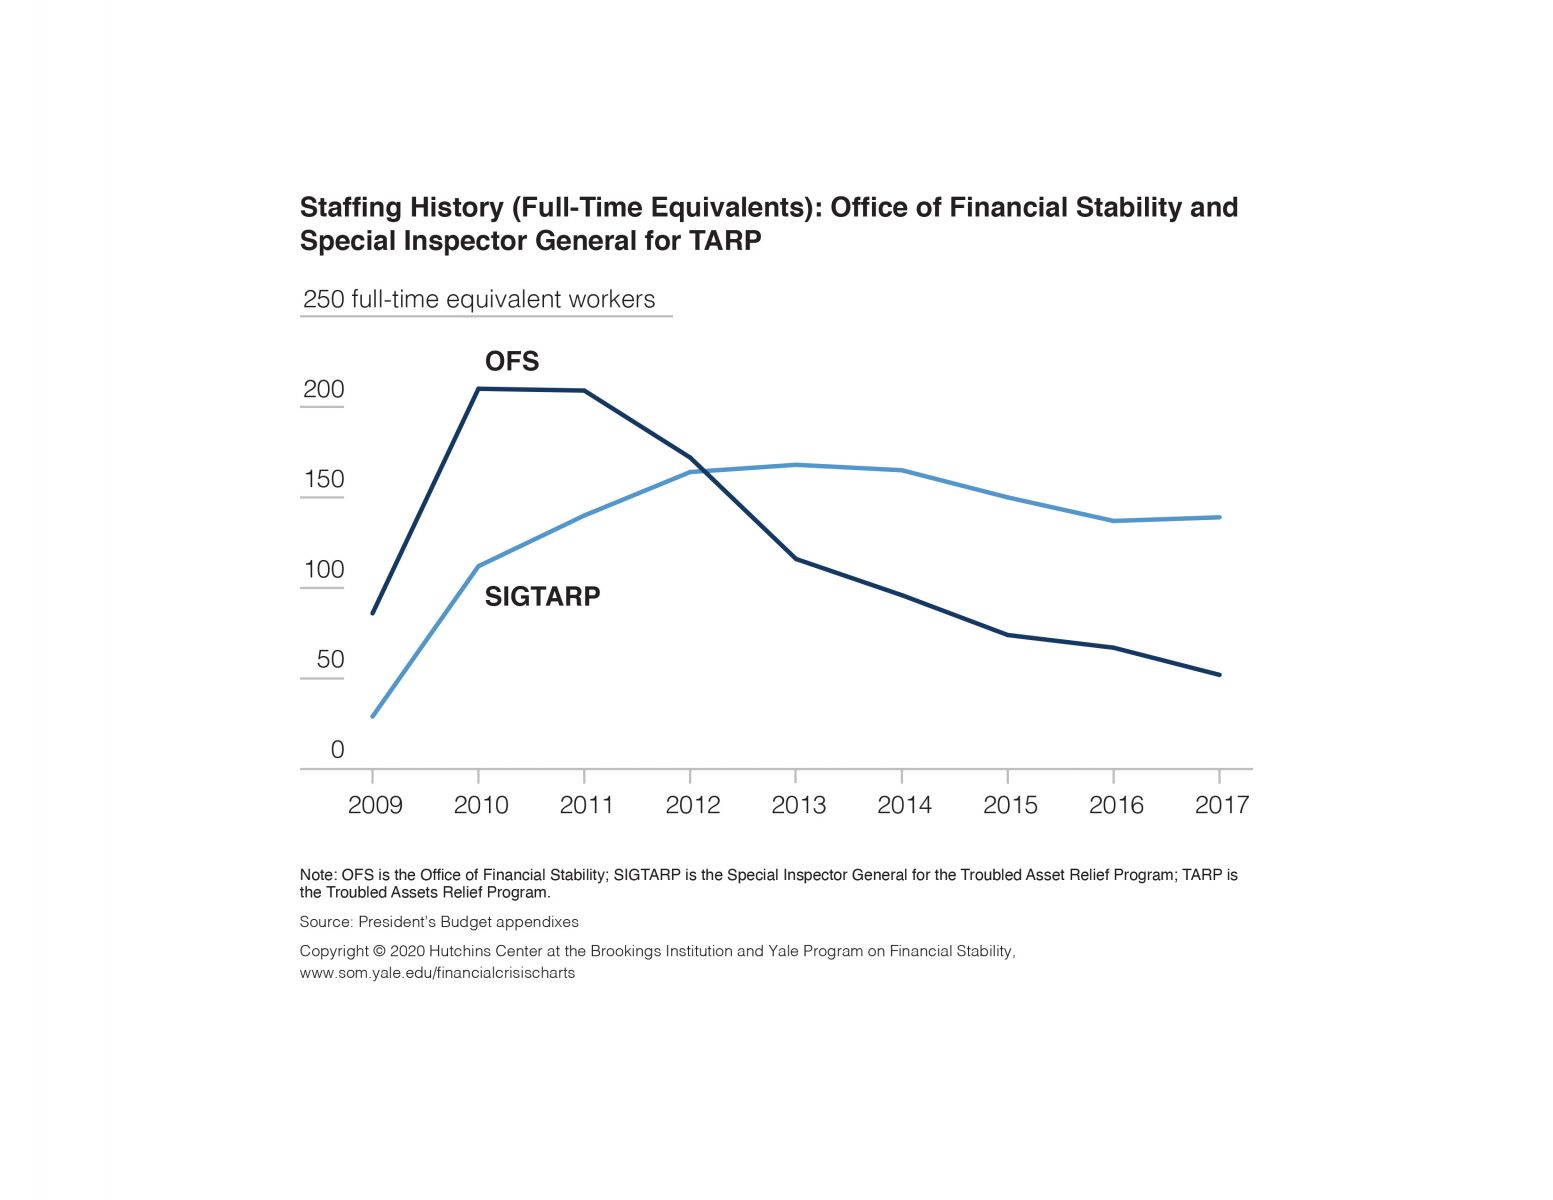
Staffing History (Full-Time Equivalents): Office of Financial Stability and Special Inspector General for TARP, 2009–2017
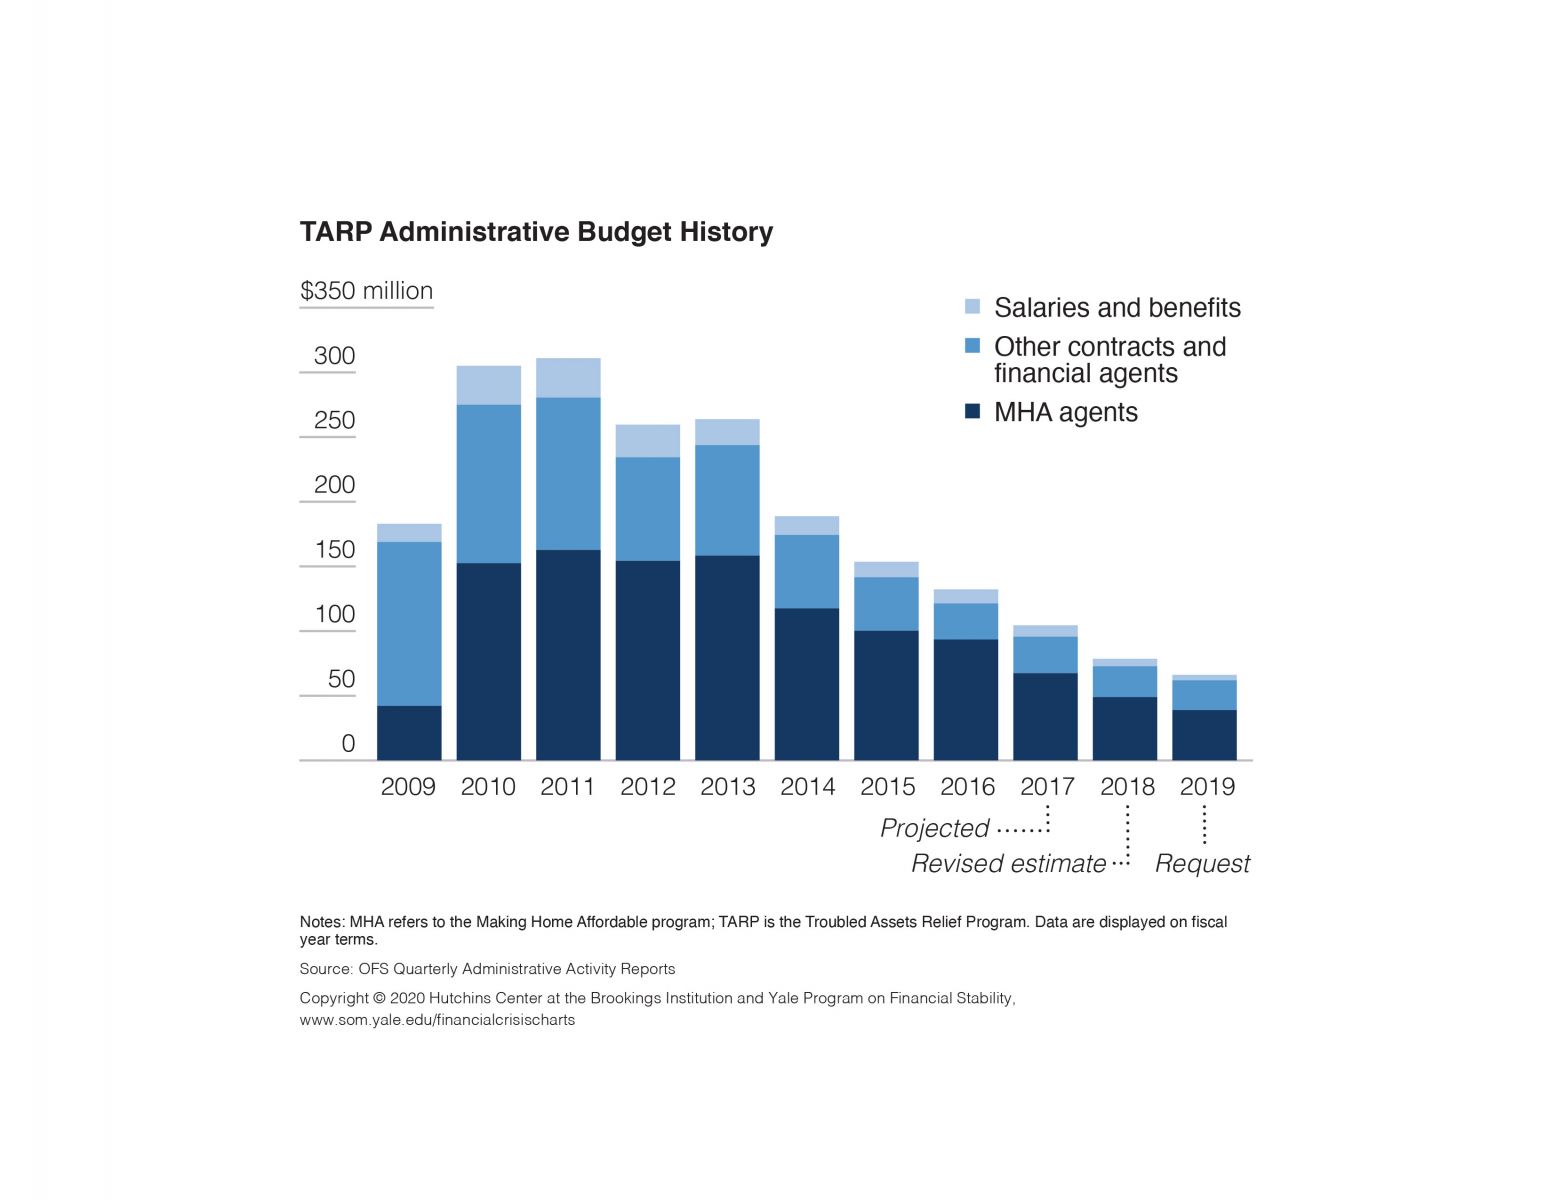
TARP Administrative Budget History, 2009–2019
Historical TARP Lifetime Cost Estimates (as of July 2019)
Monetary Policy and Fiscal Policy
Monetary Policy
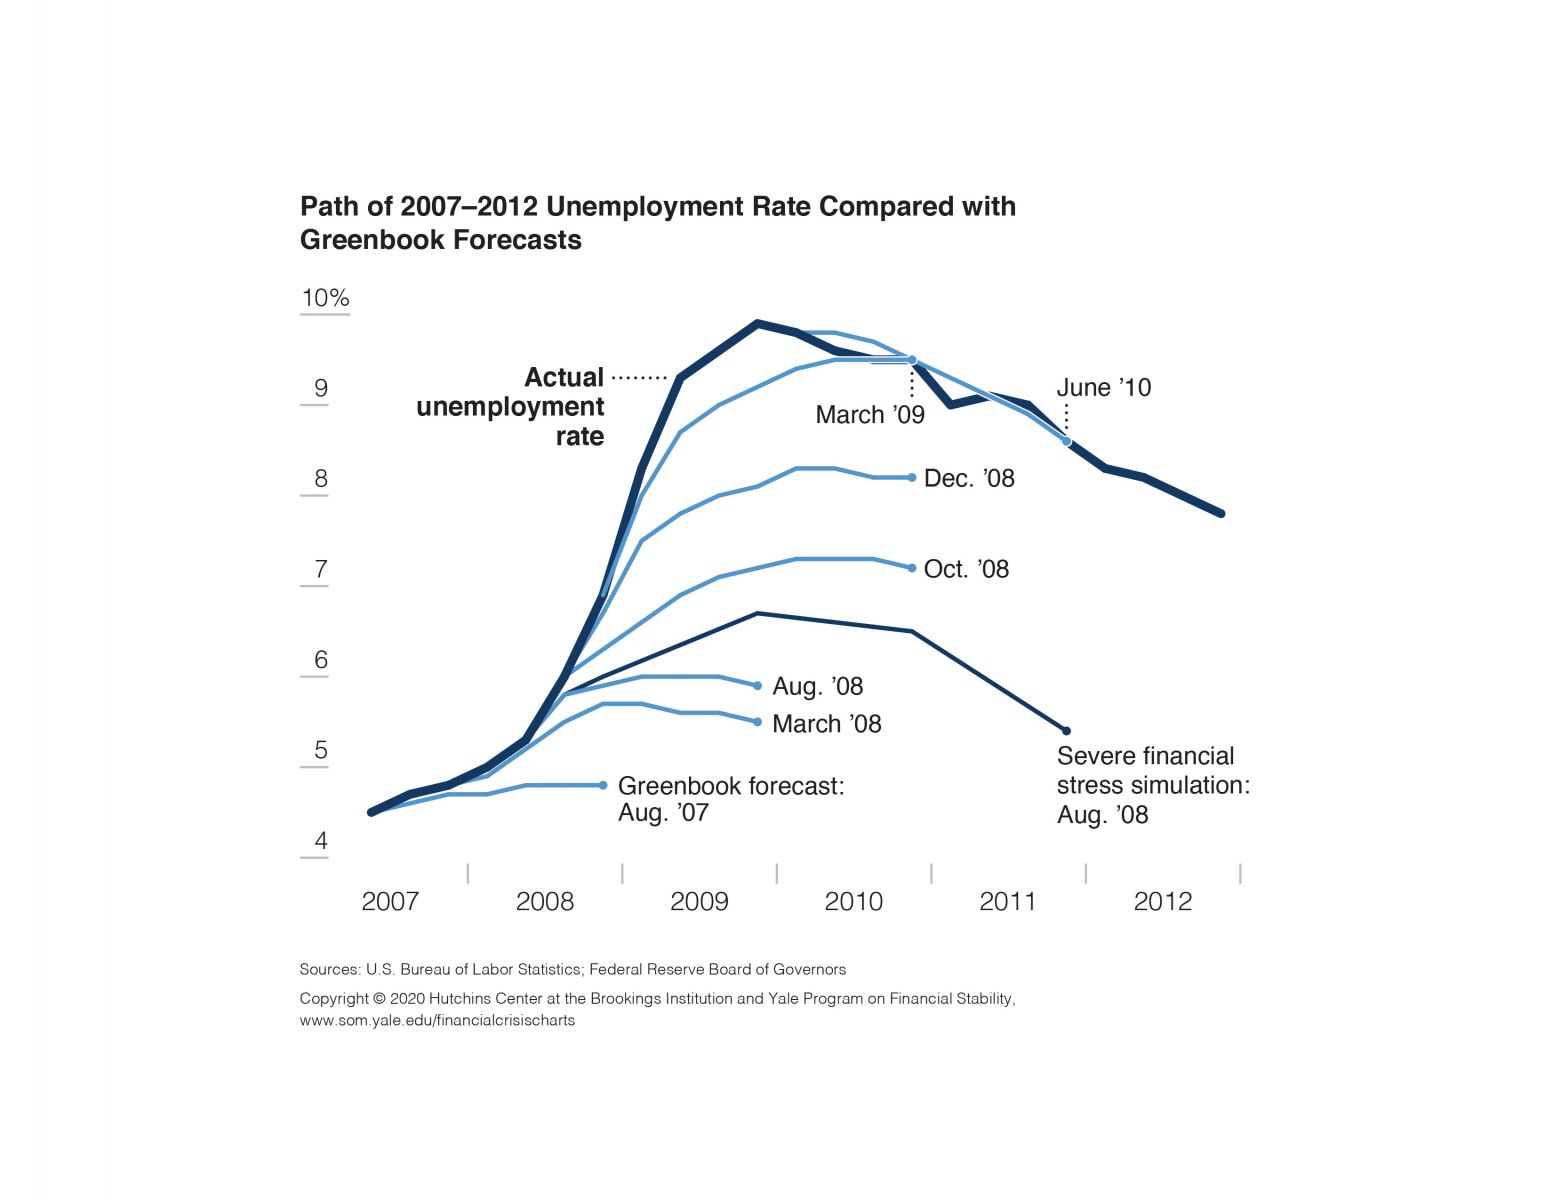
Path of 2007–2012 Unemployment Rate Compared with Greenbook Forecasts
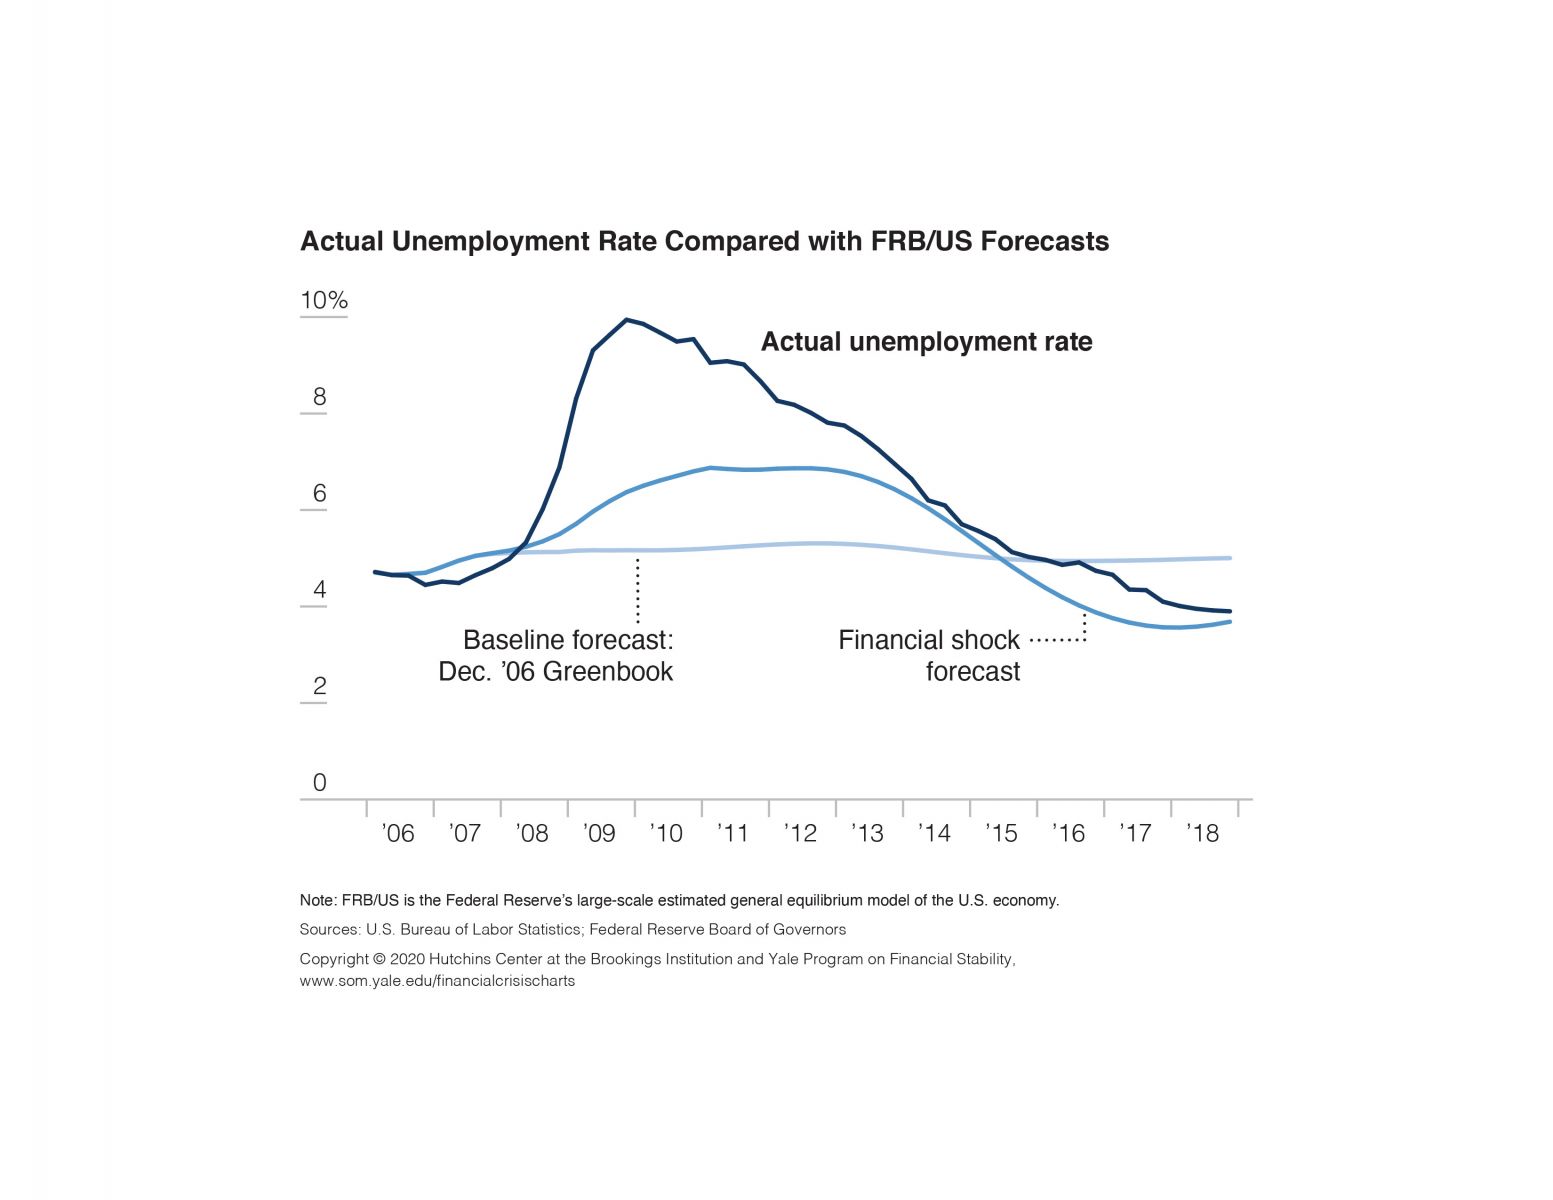
Actual Unemployment Rate Compared with FRB/US Forecasts
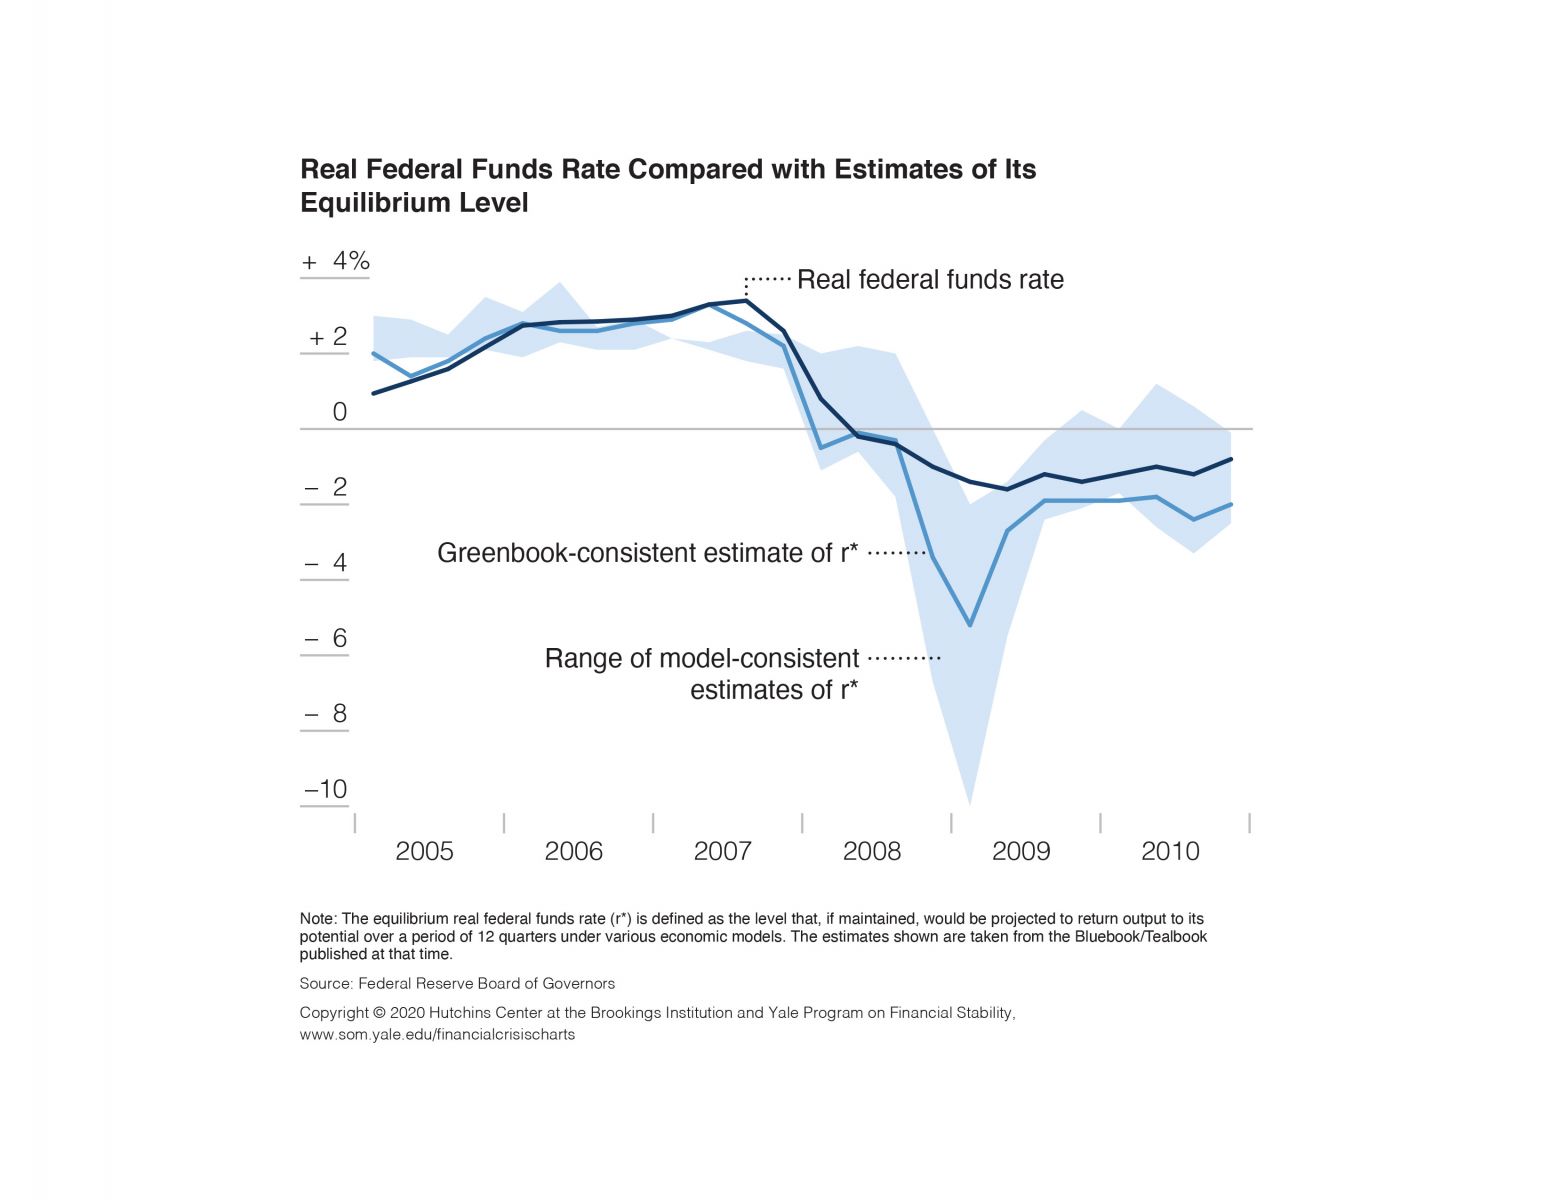
Real Federal Funds Rate 2005–2010 Compared with Estimates of Its Equilibrium Level
Risk Premiums during Asset Purchase Programs, 2008–2014
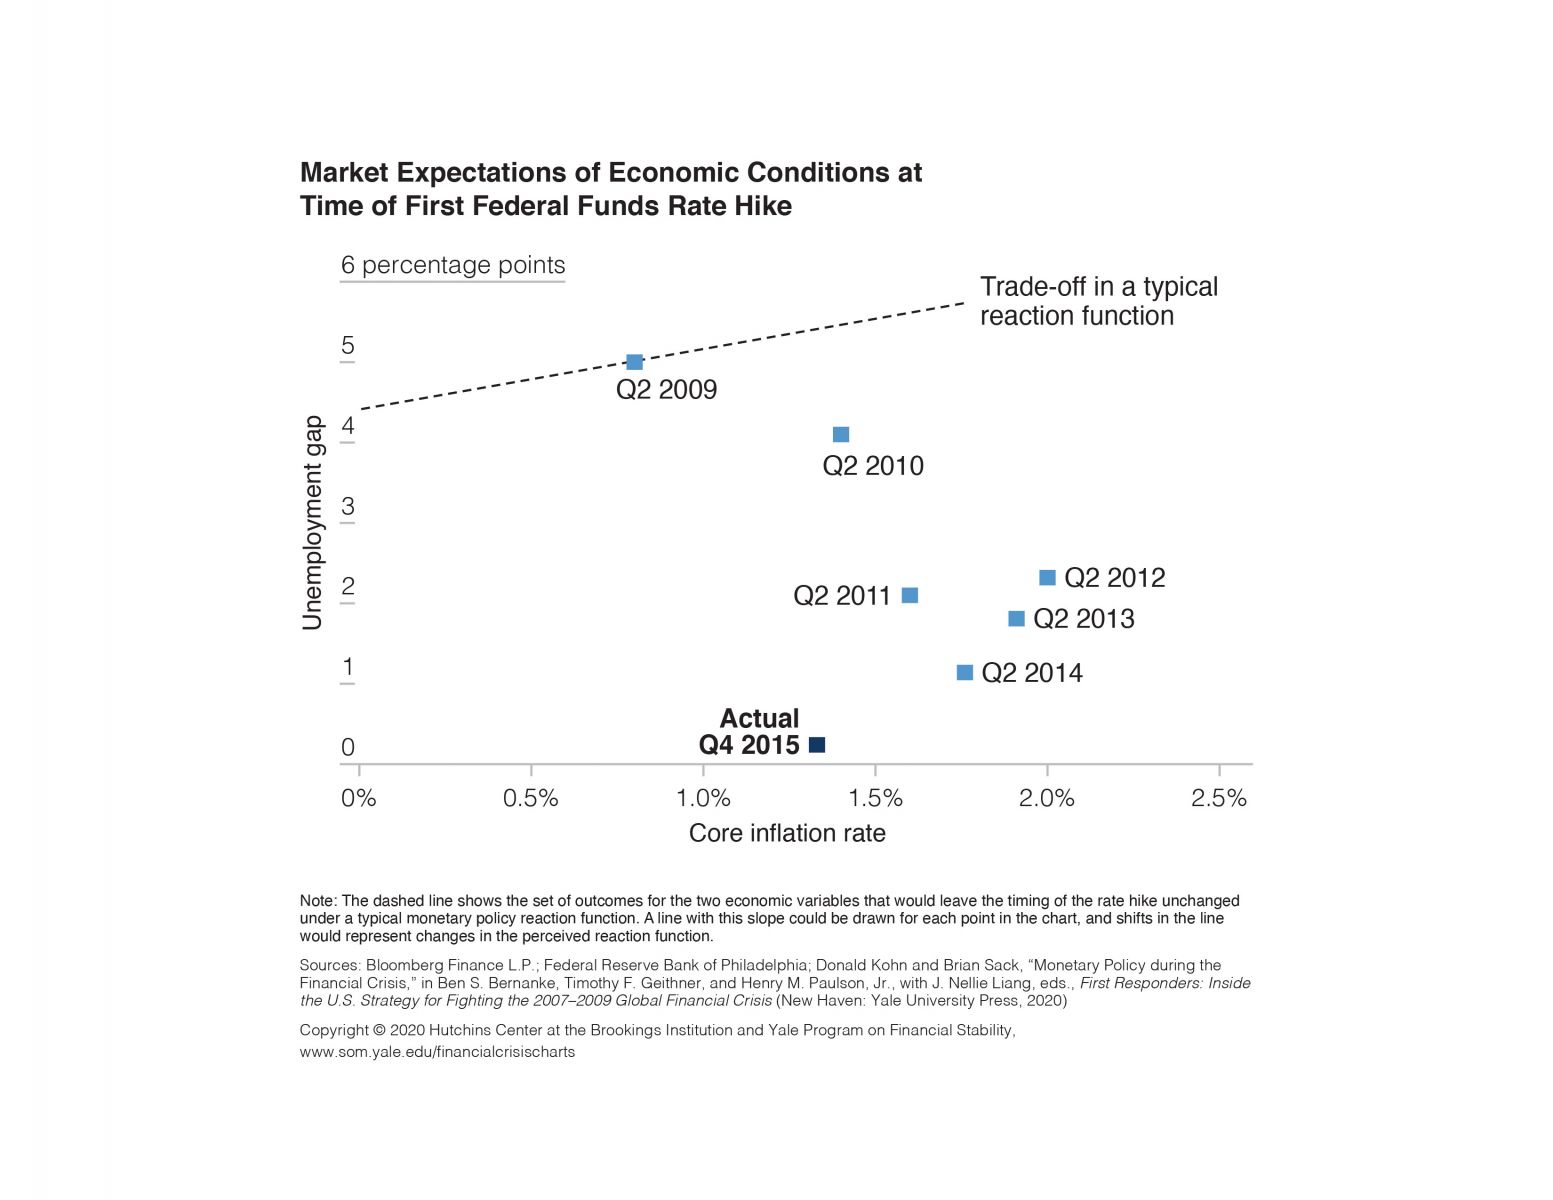
Market Expectations of Economic Conditions at Time of First Federal Funds Rate Hike
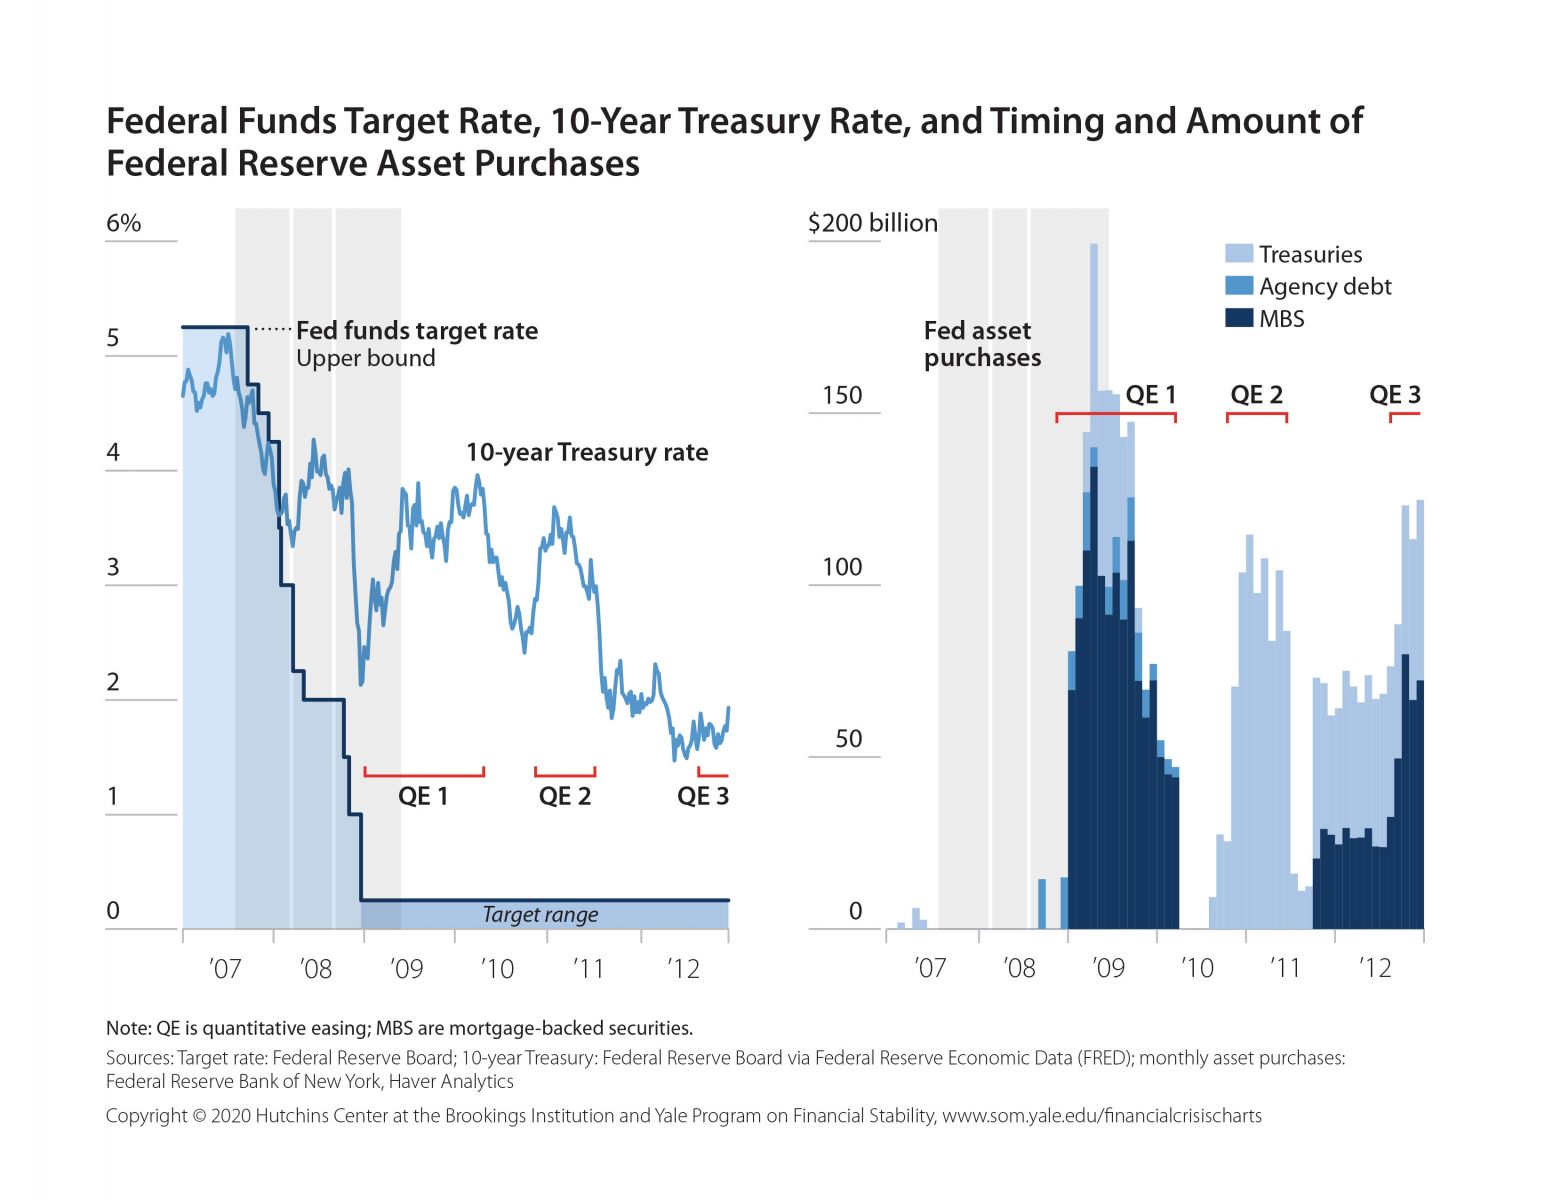
Federal Funds Target Rate, 10-Year Treasury Rate, and Timing and Amount of Federal Reserve Asset Purchases, 2007–2012
Fiscal Policy
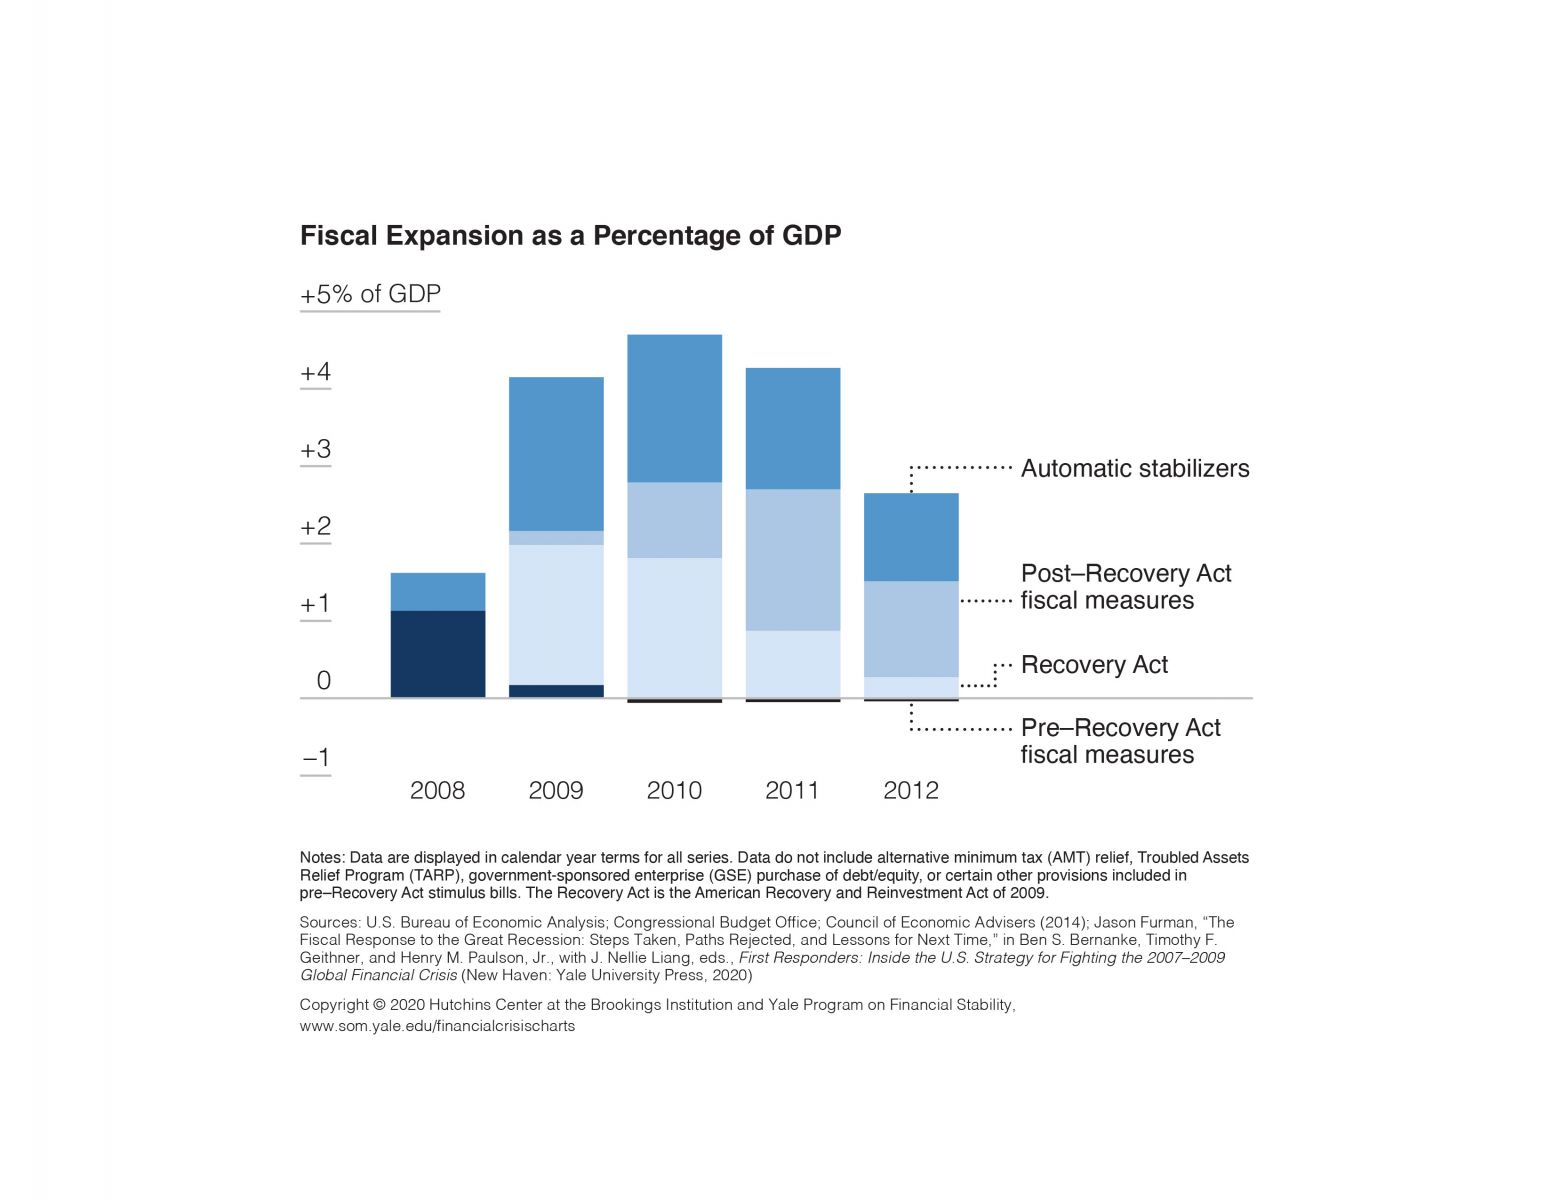
Fiscal Expansion as a Percentage of GDP, 2008–2012
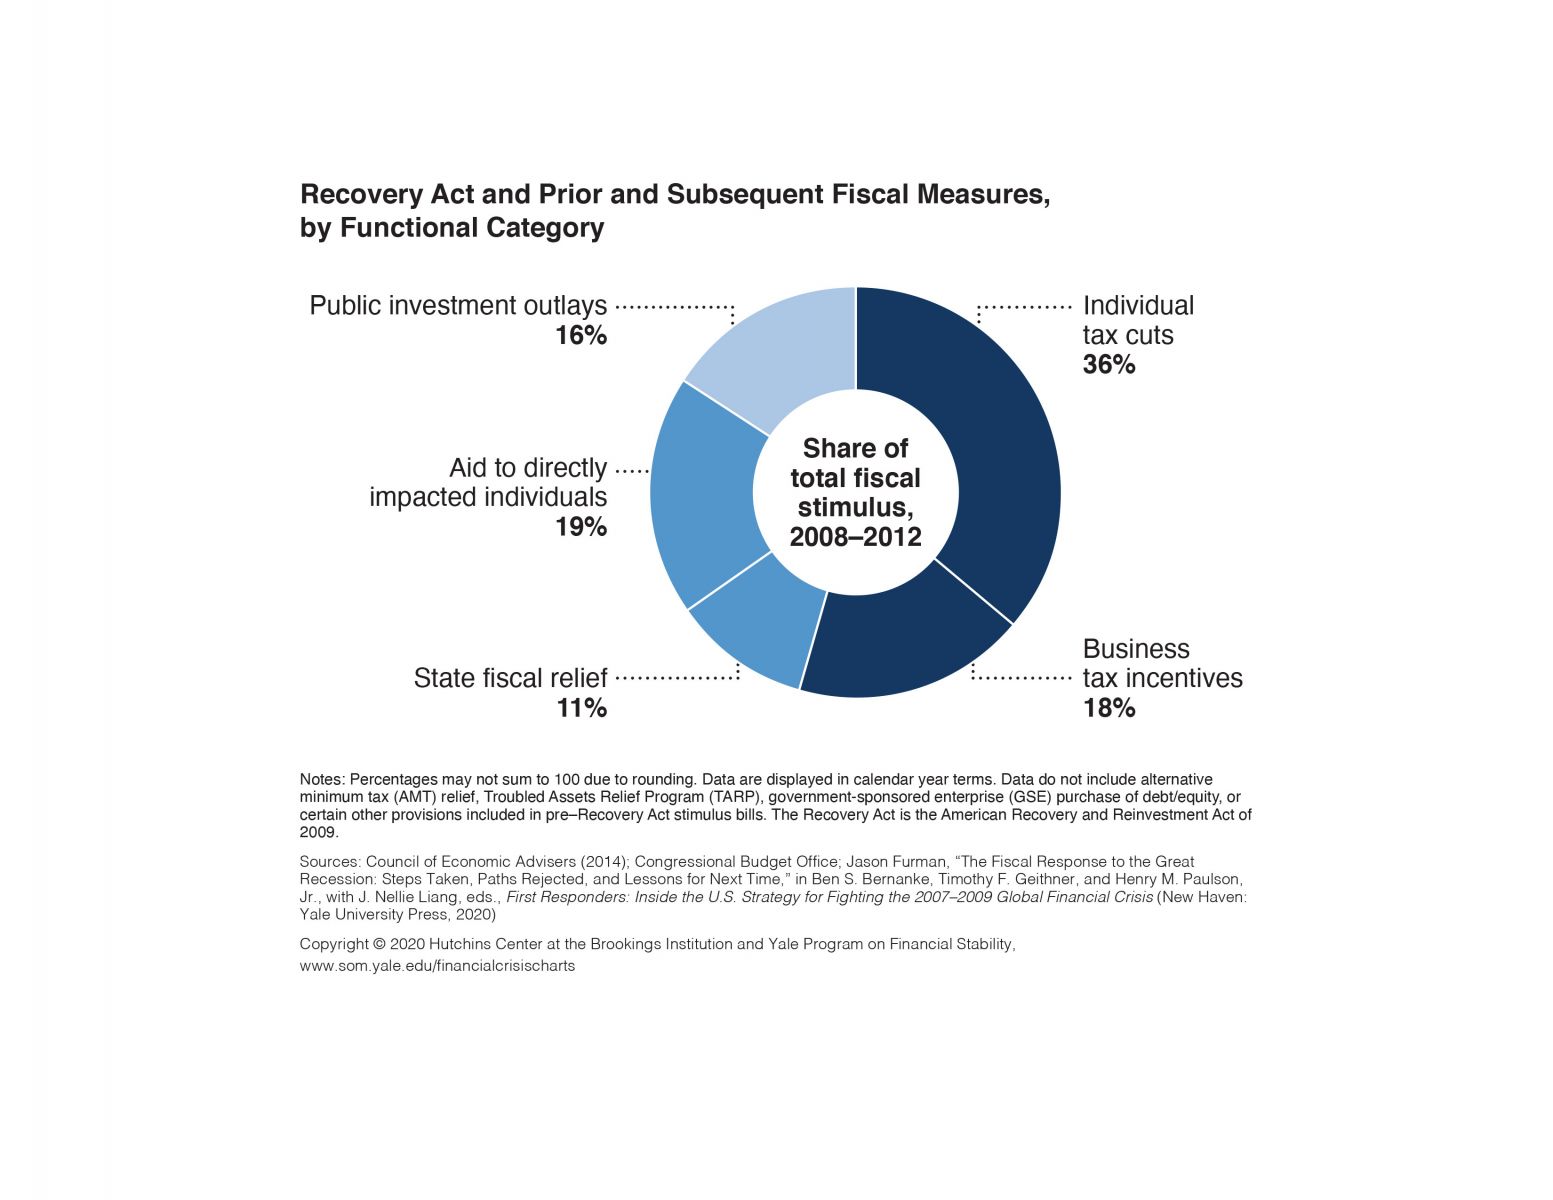
Recovery Act and Prior and Subsequent Fiscal Measures, by Functional Category
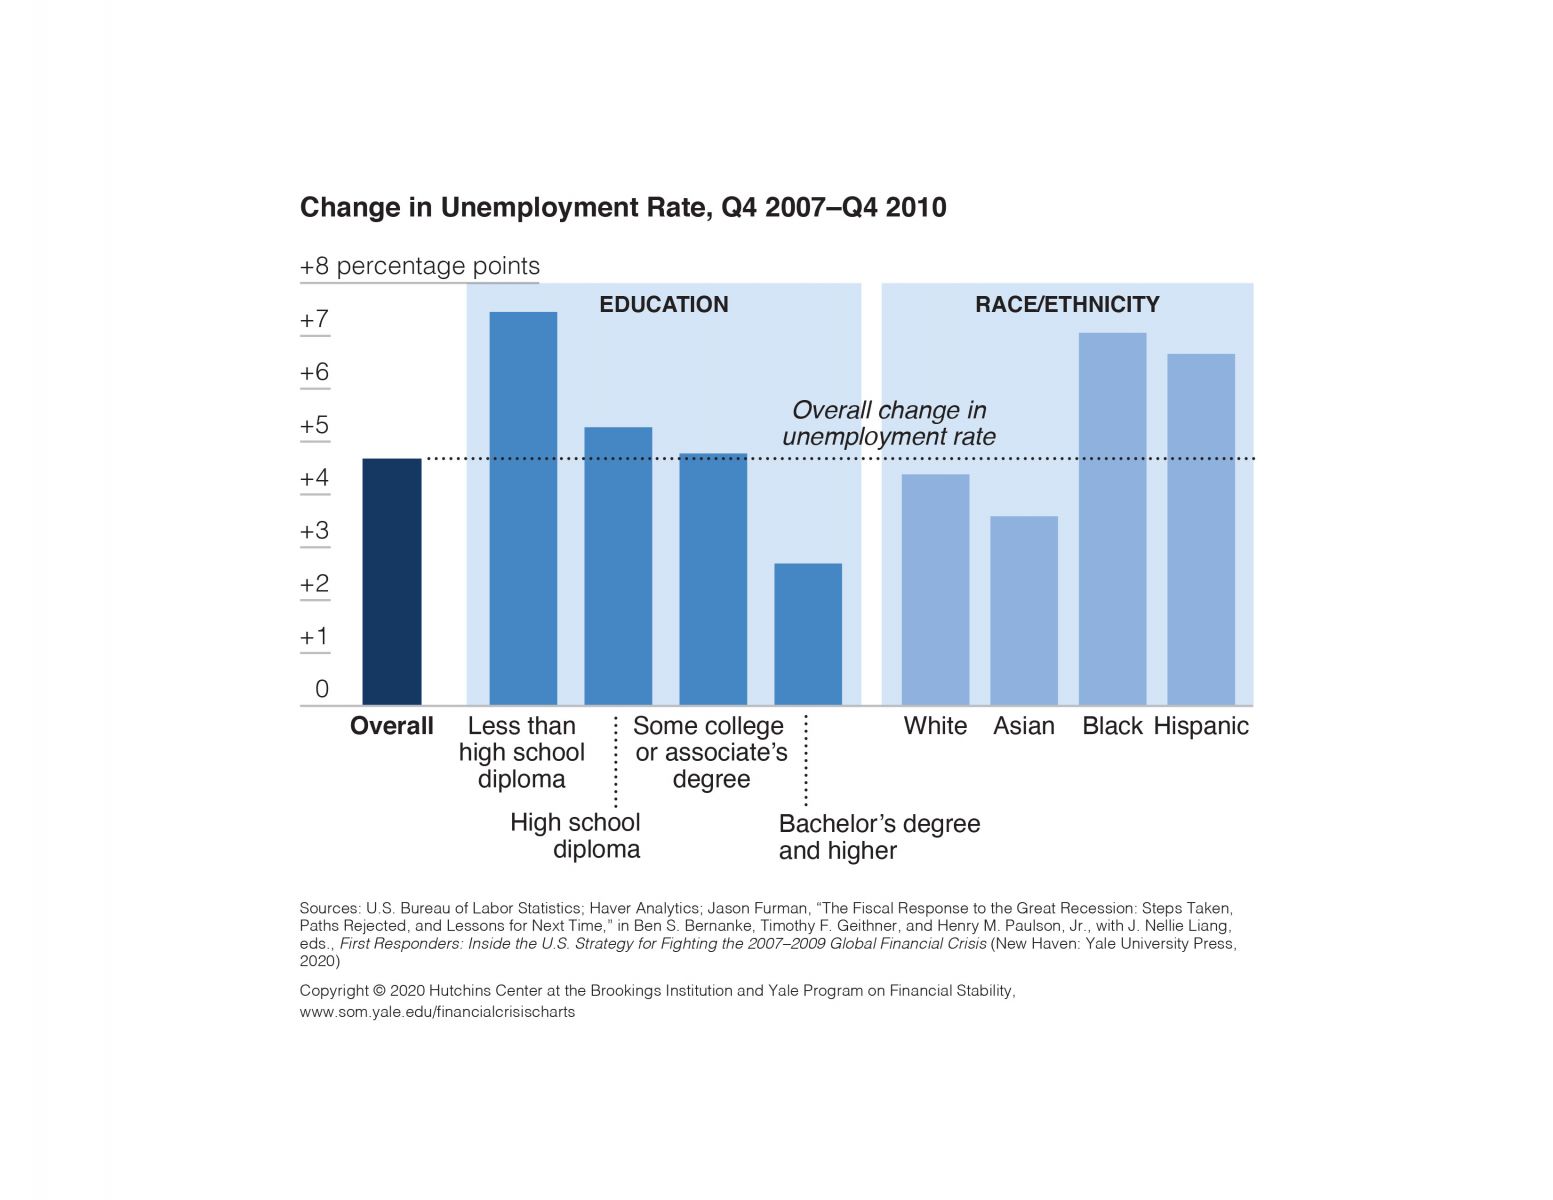
Change in Unemployment Rate, Q4 2007–Q4 2010
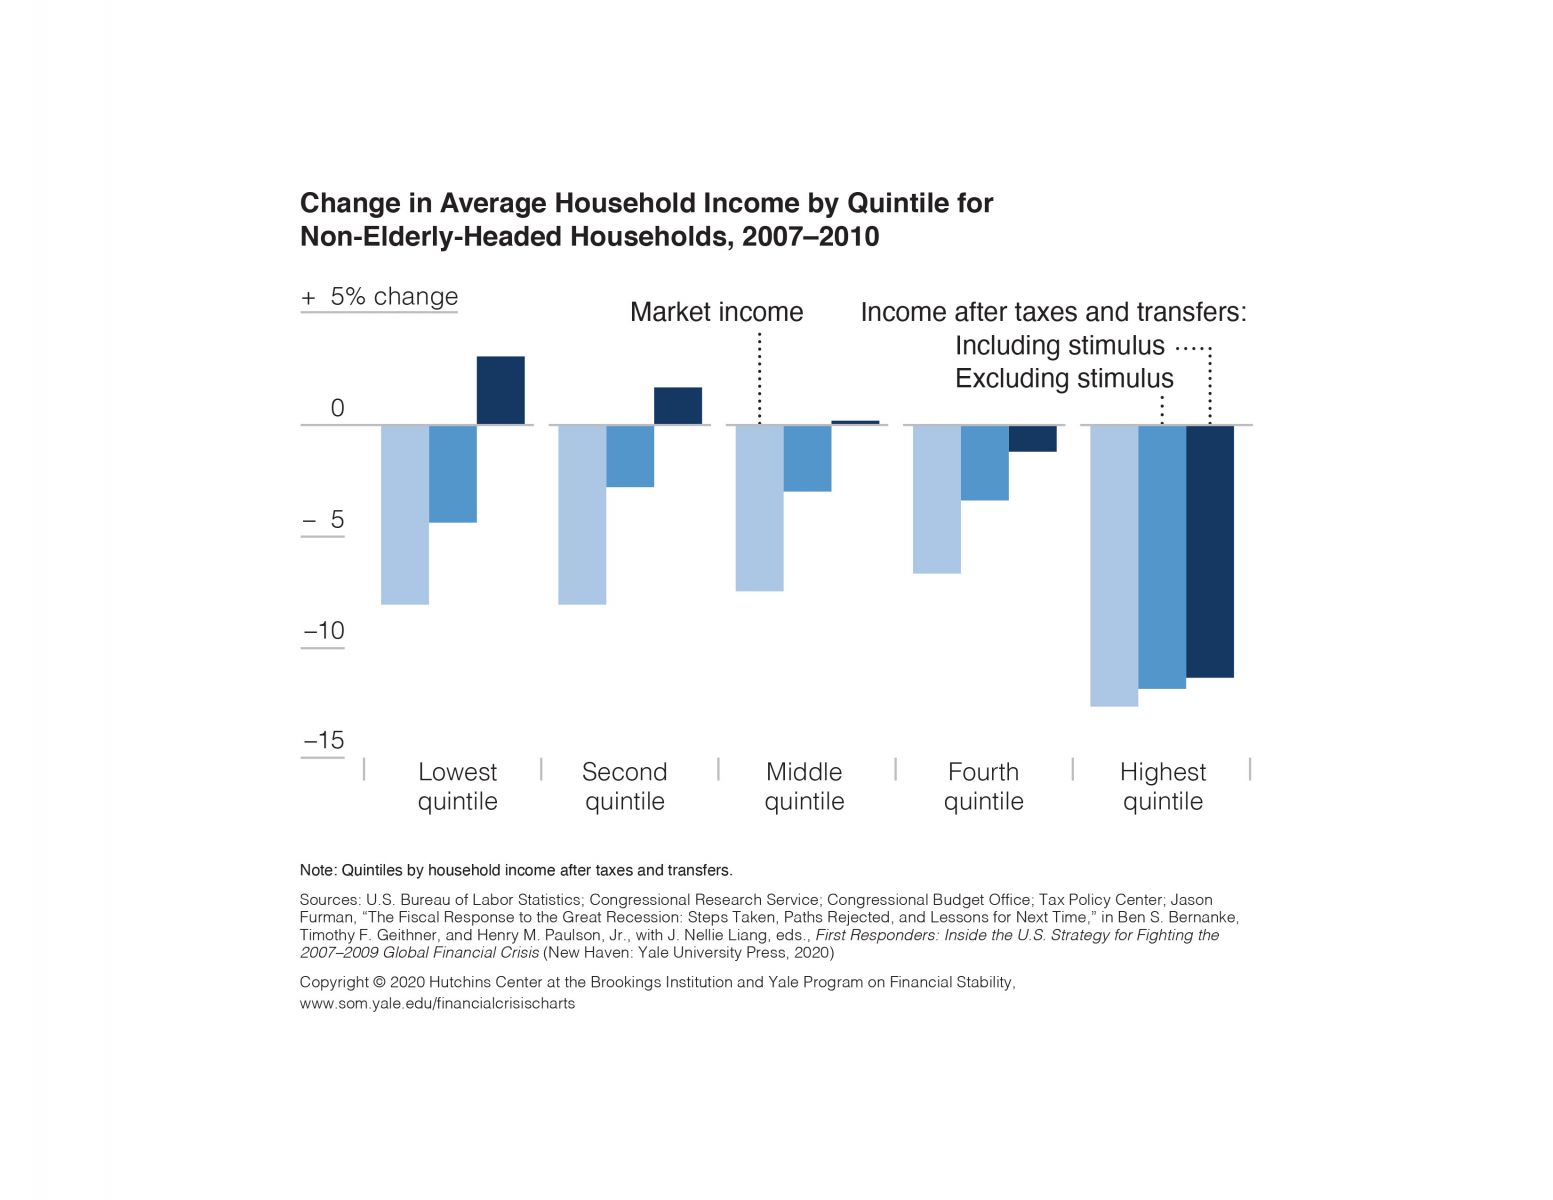
Change in Average Household Income by Quintile for Non-Elderly-Headed Households, 2007–2010
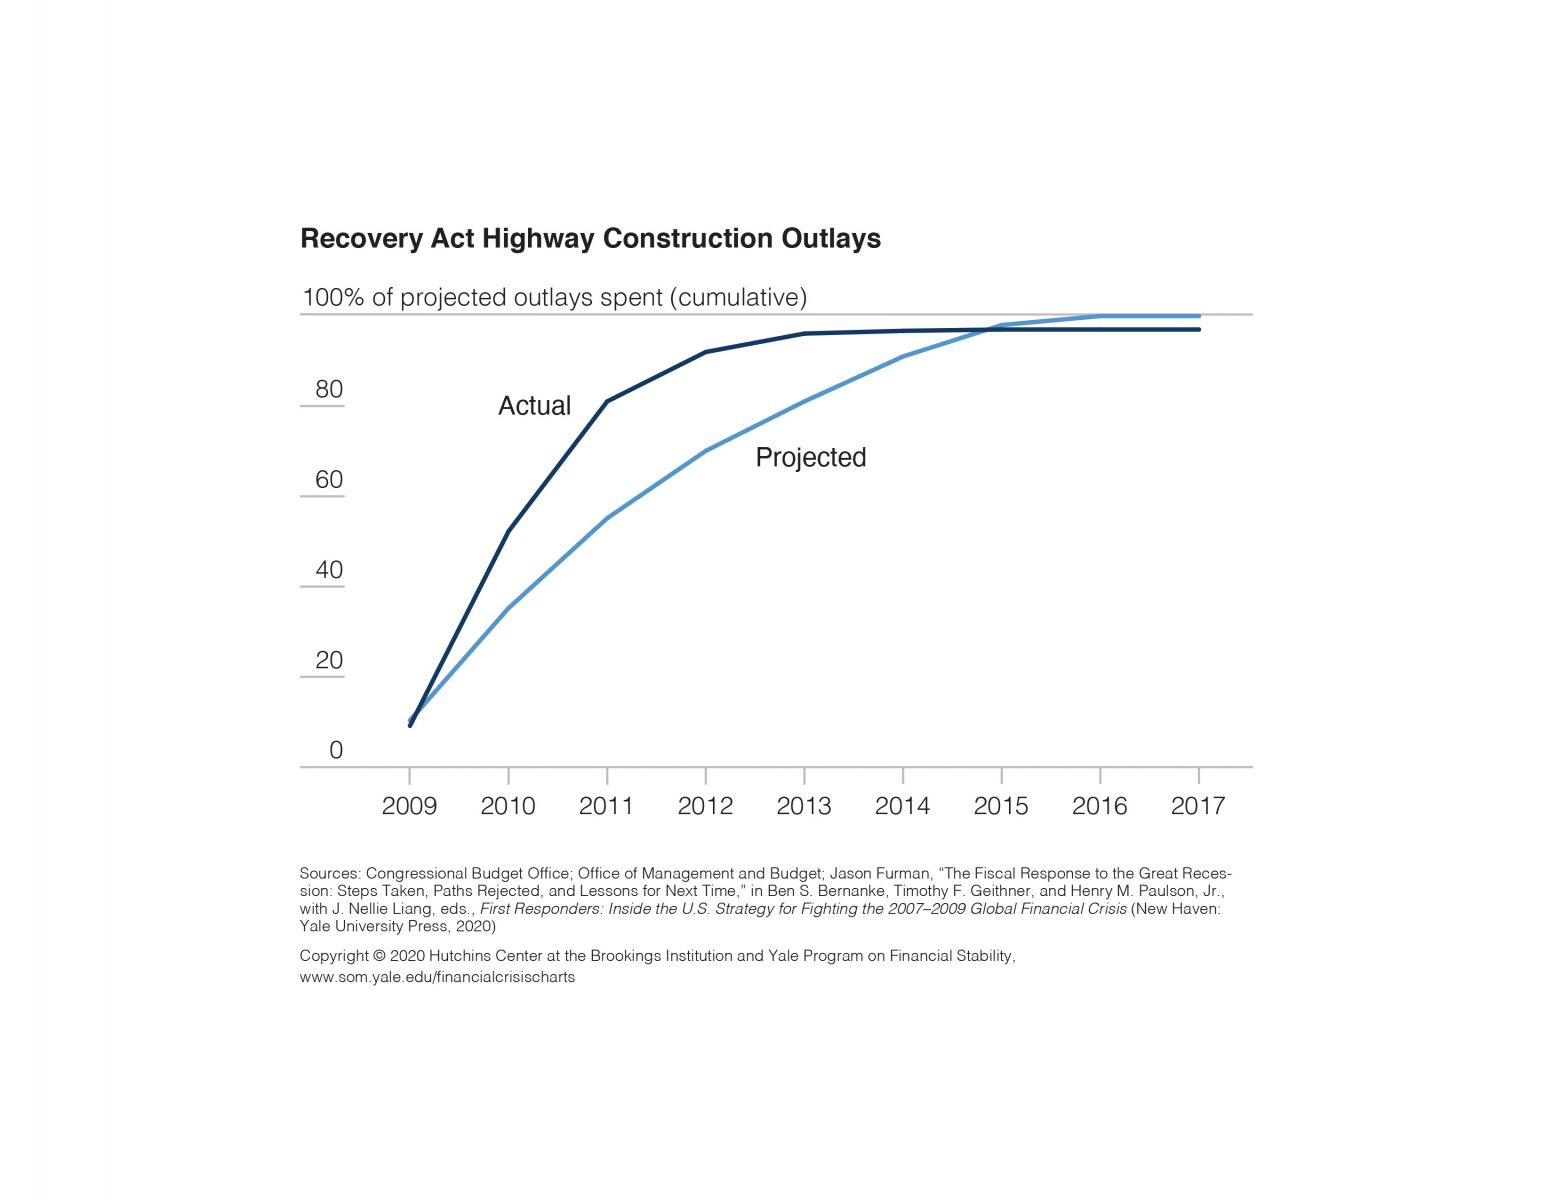
Recovery Act Highway Construction Outlays, 2009–2017
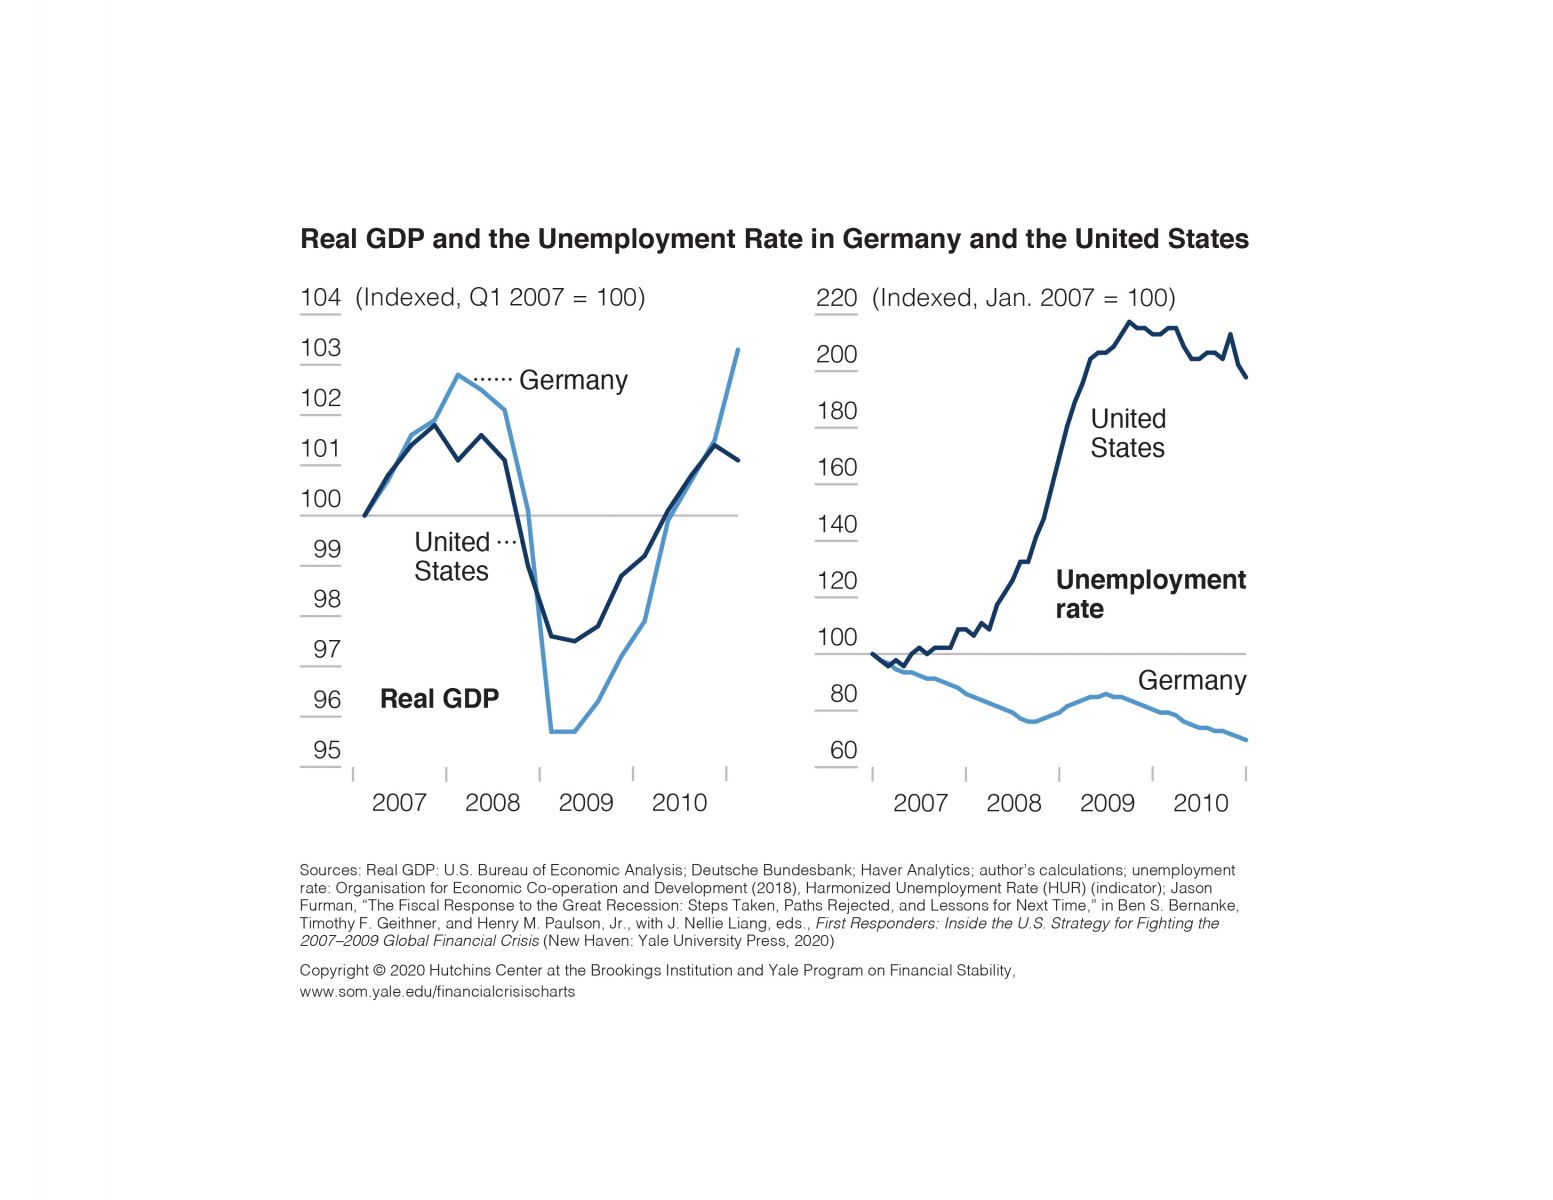
Real GDP Growth and the Unemployment Rate in Germany and the United States, 2007–2010
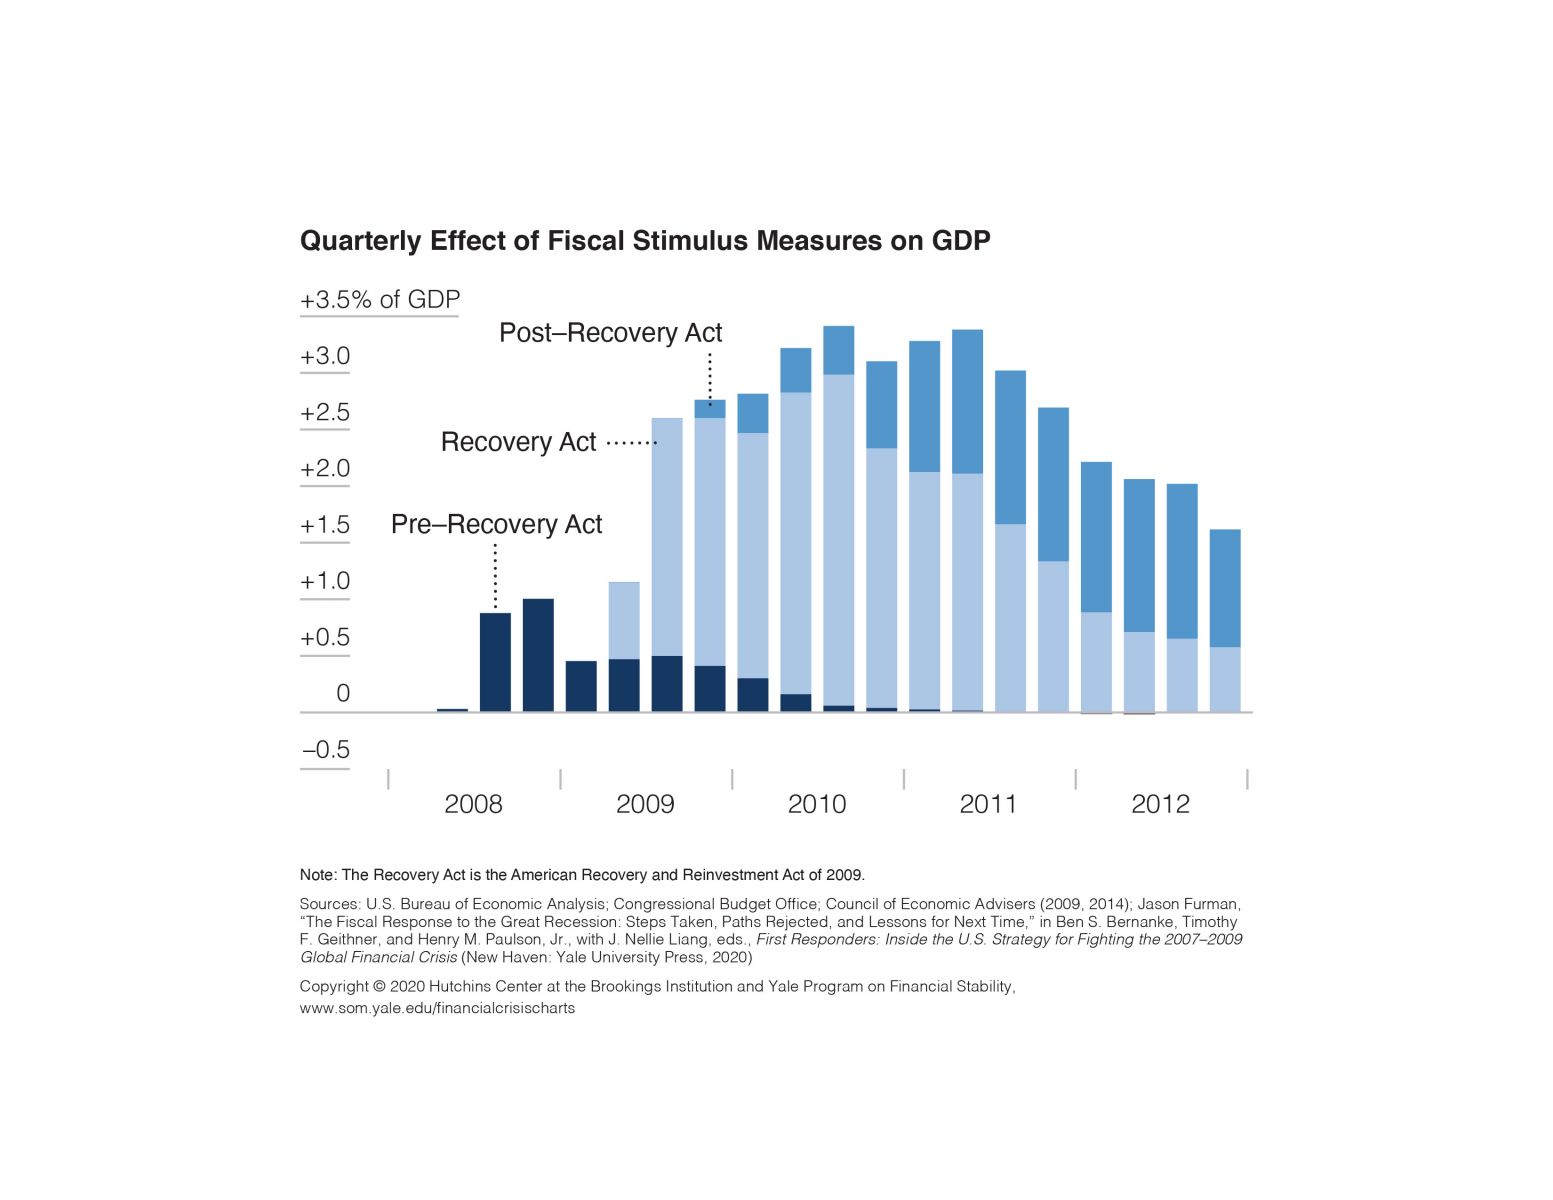
Quarterly Effect of Fiscal Stimulus Measures on GDP, 2008–2012
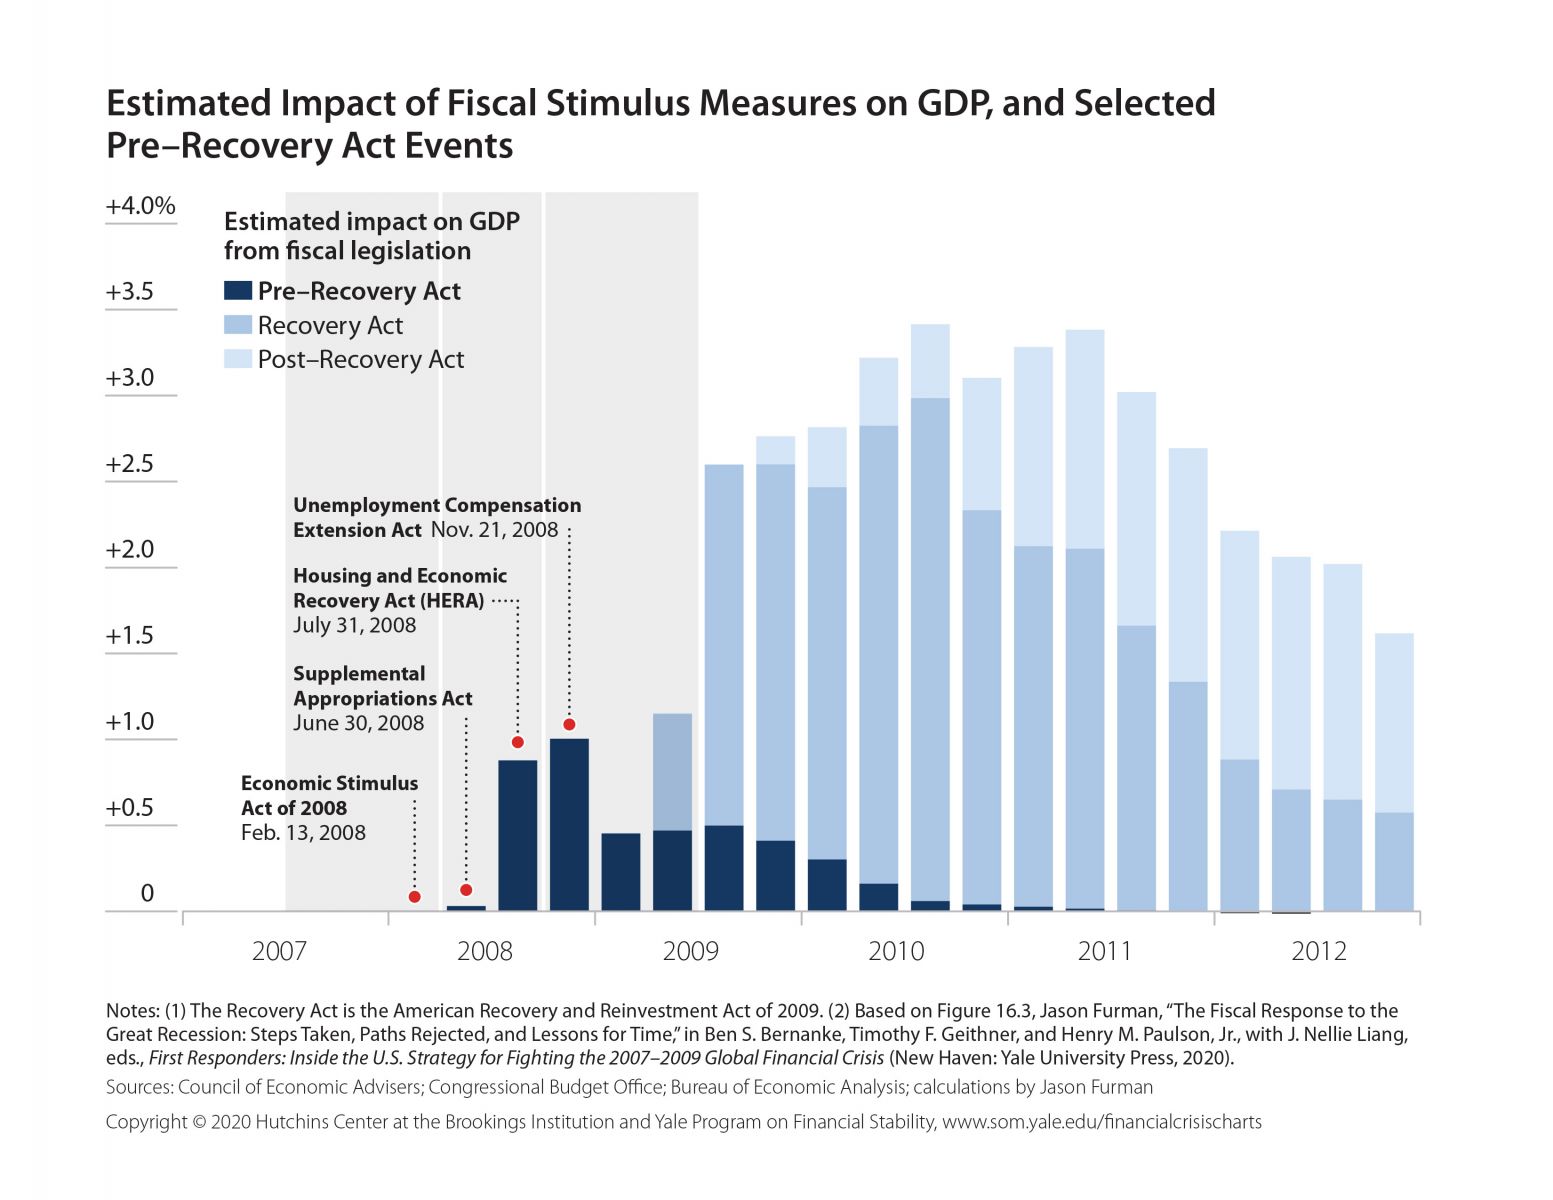
Estimated Impact of Fiscal Stimulus Measures on GDP, 2007–2012, and Selected Pre–Recovery Act Events
Estimated Impact of Fiscal Stimulus Measures on GDP, 2007–2012, and Selected Recovery Act Events
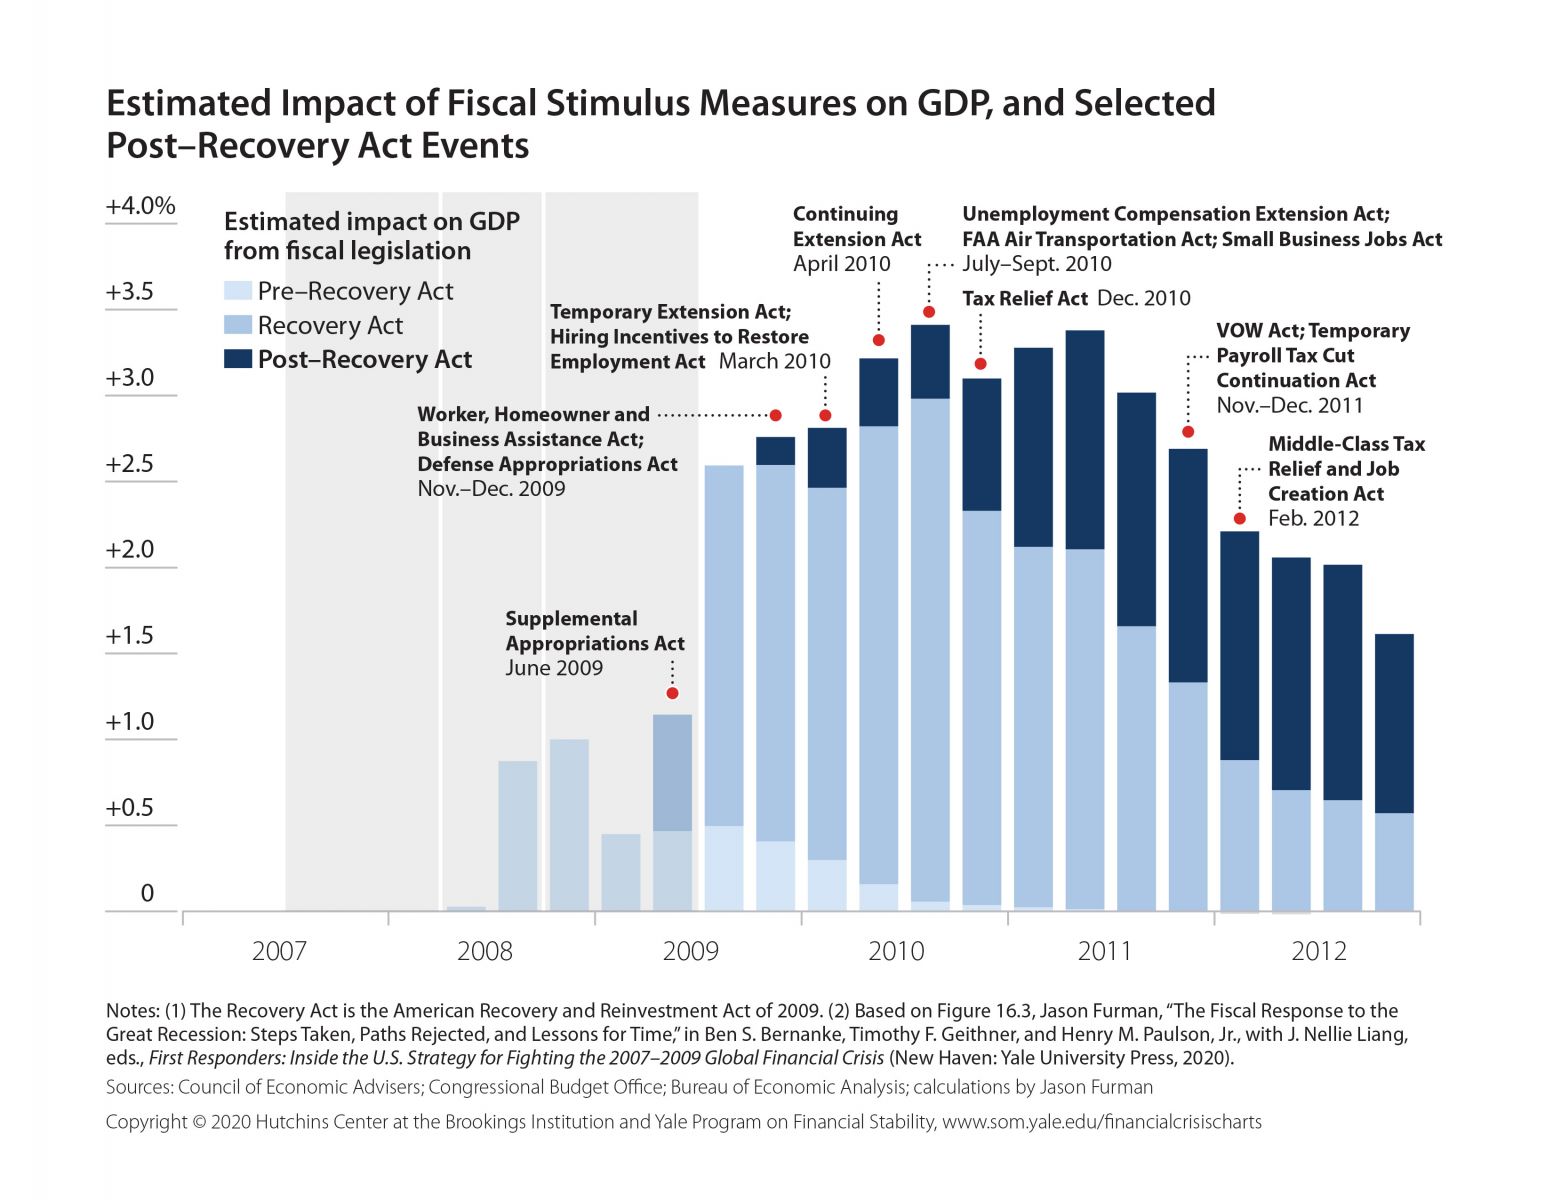
Estimated Impact of Fiscal Stimulus Measures on GDP, 2007–2012, and Selected Post–Recovery Act Events
State and Local Government Purchases during Recession Recovery Periods (average across recessionary periods 1960–2007 and specific recessions)
GSEs and Housing
GSEs
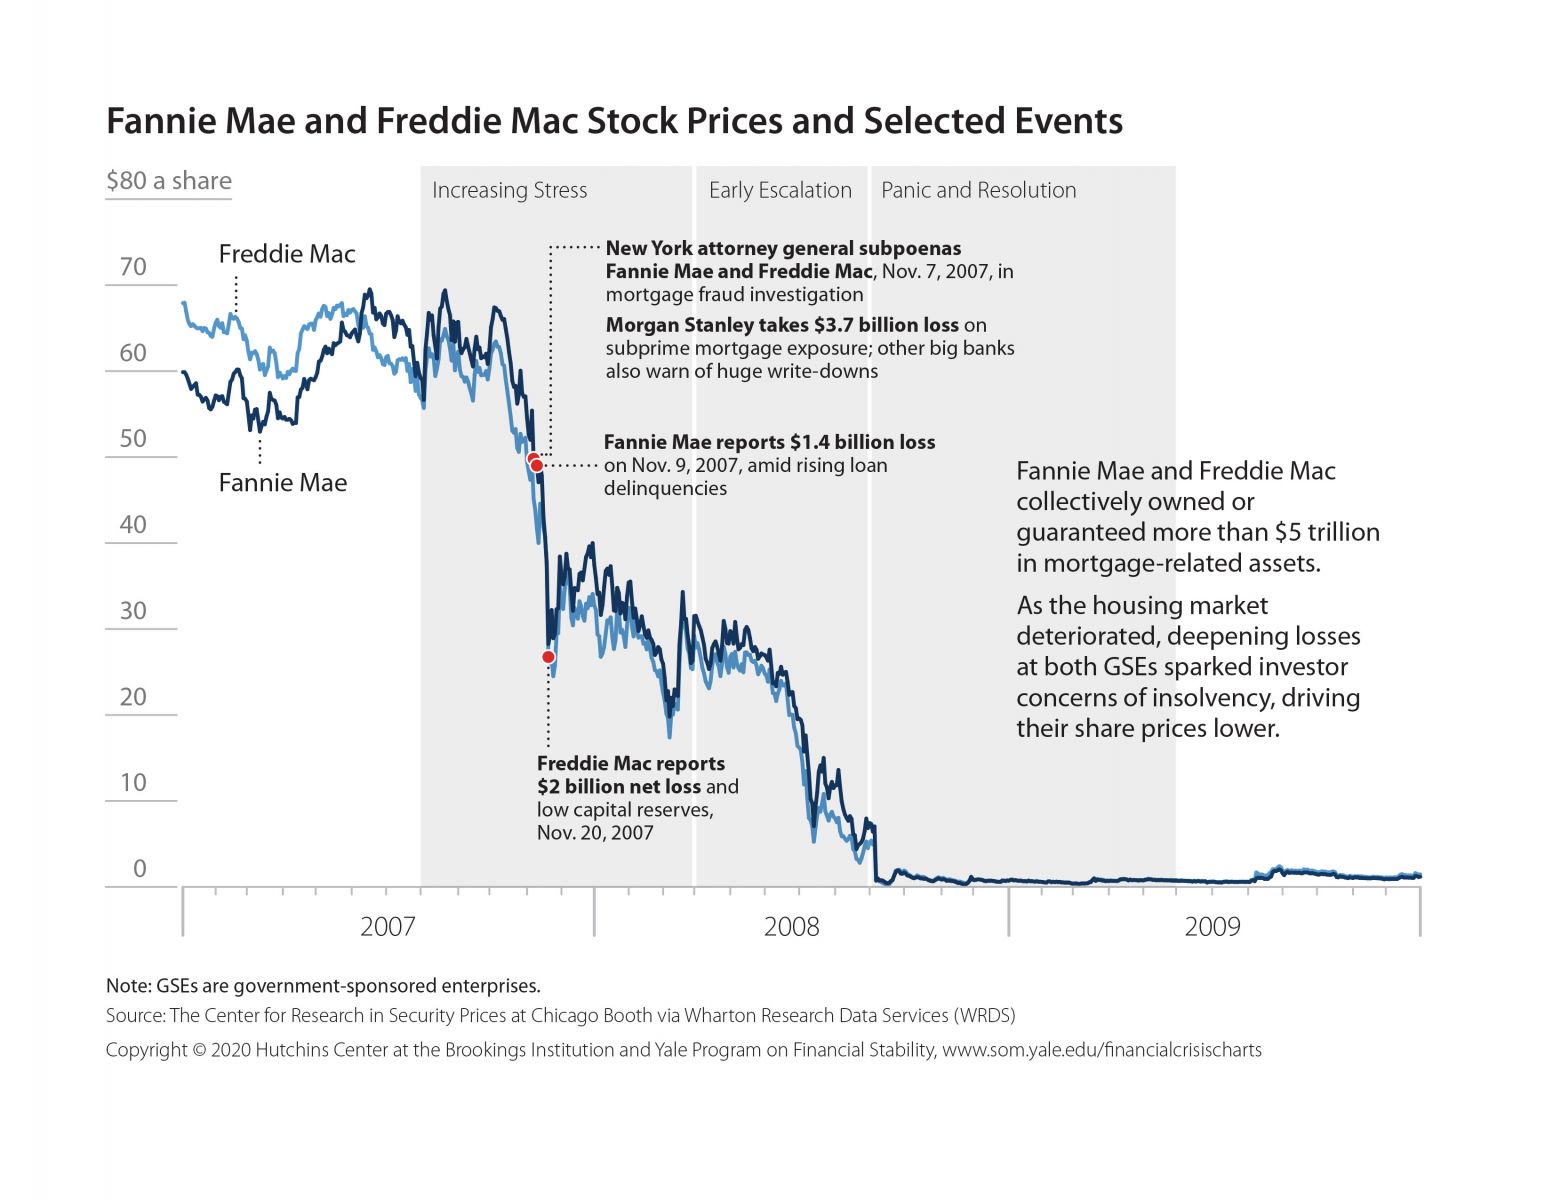
Fannie Mae and Freddie Mac Stock Prices and Selected Events, 2007–2009
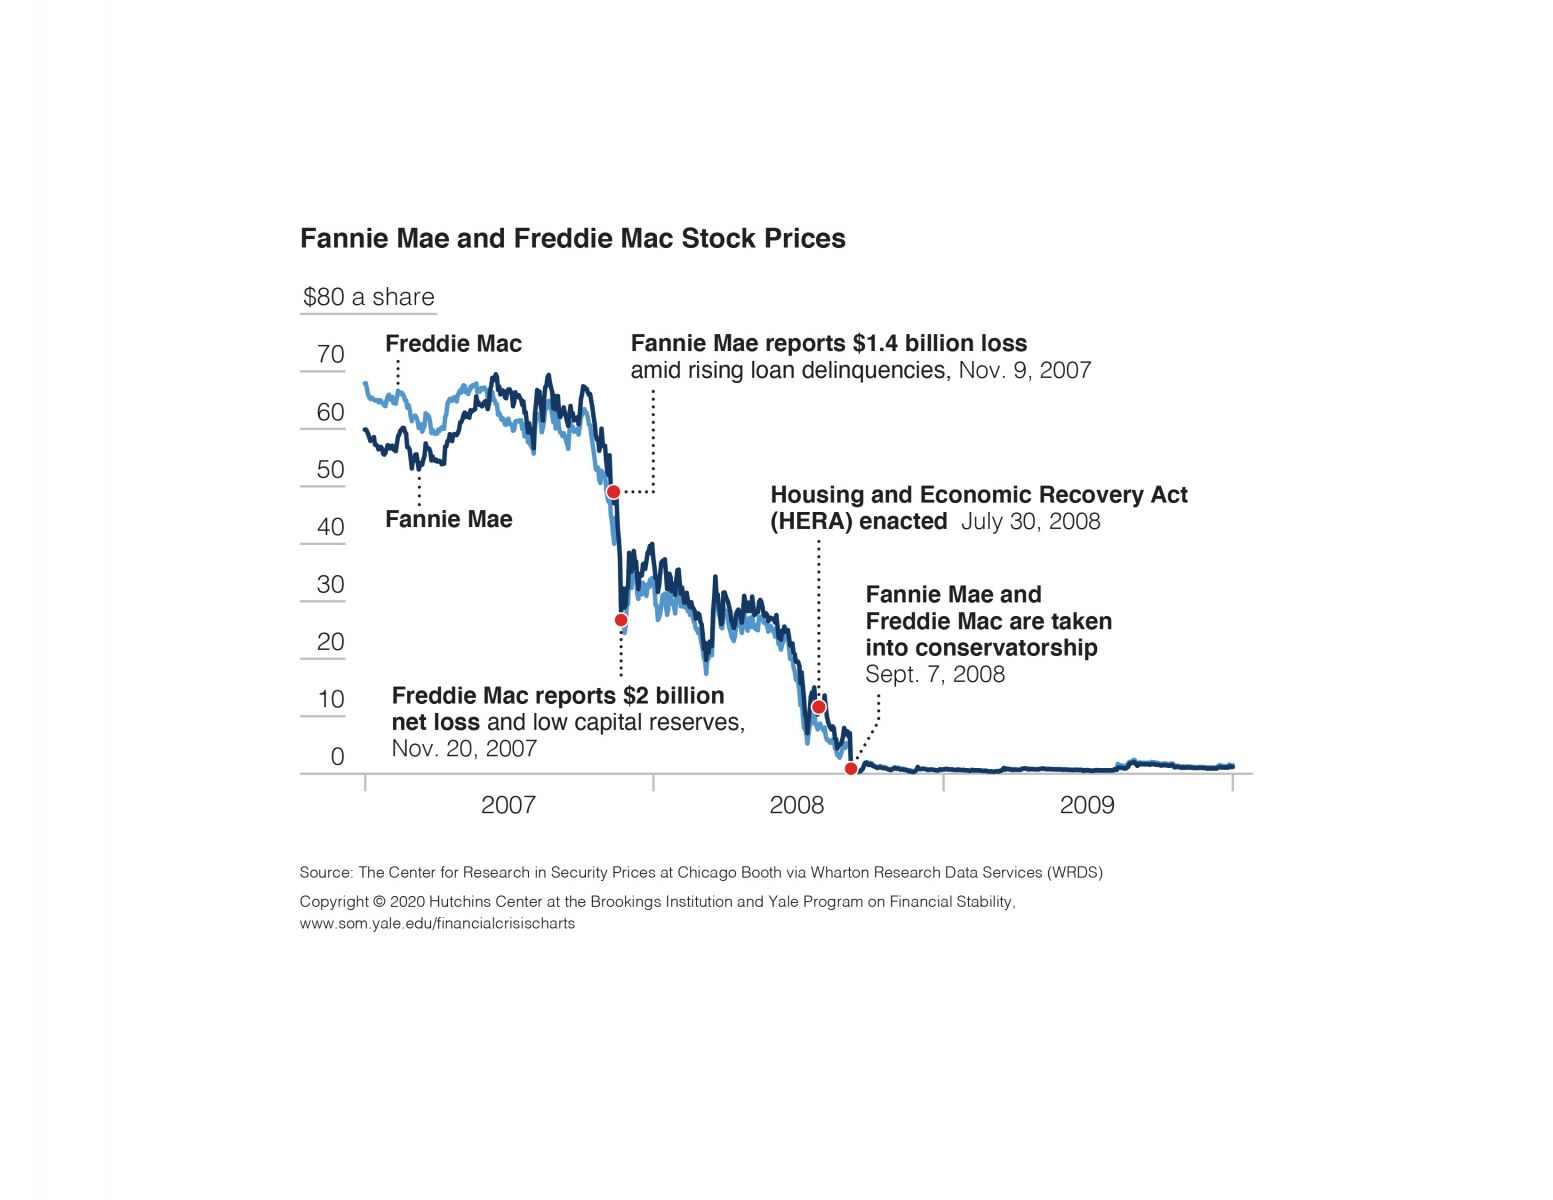
Fannie Mae and Freddie Mac Stock Prices, 2007–2009
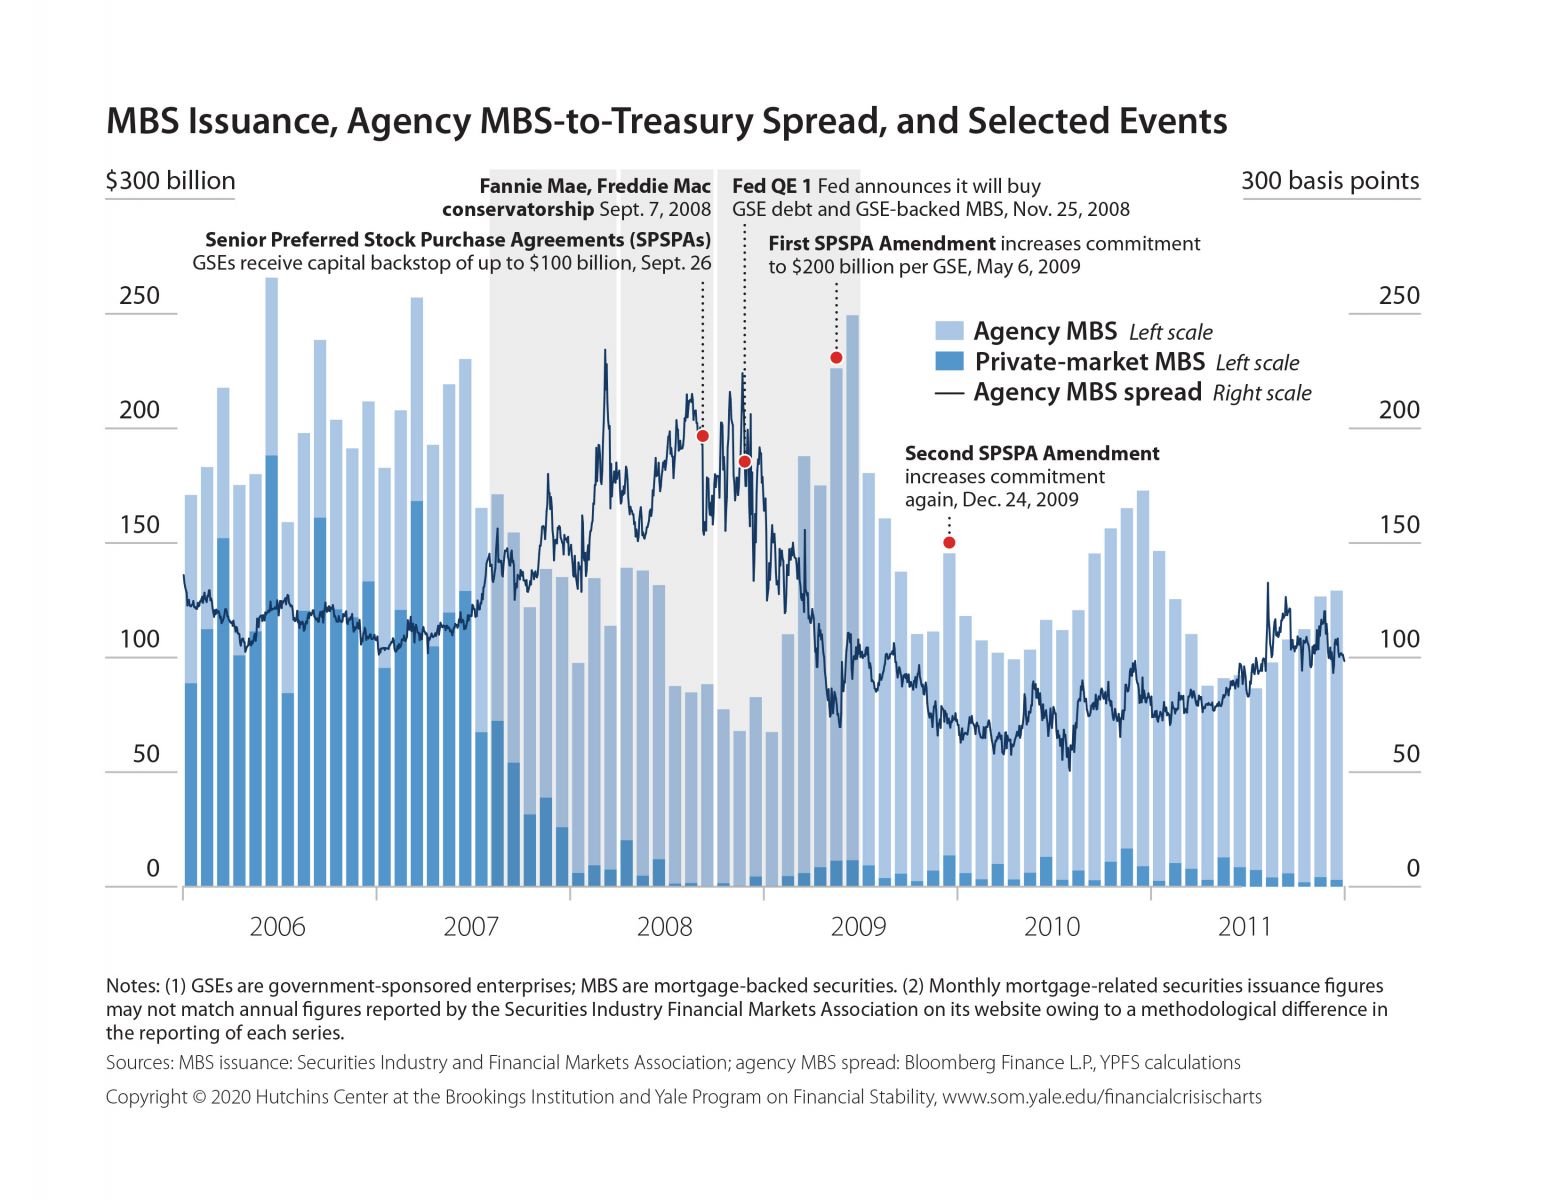
MBS Issuance and Agency MBS-to-Treasury Spread, 2006–2011
Net Capital Flows from the Senior Preferred Stock Purchase Agreements, Q2 2008–Q3 2018
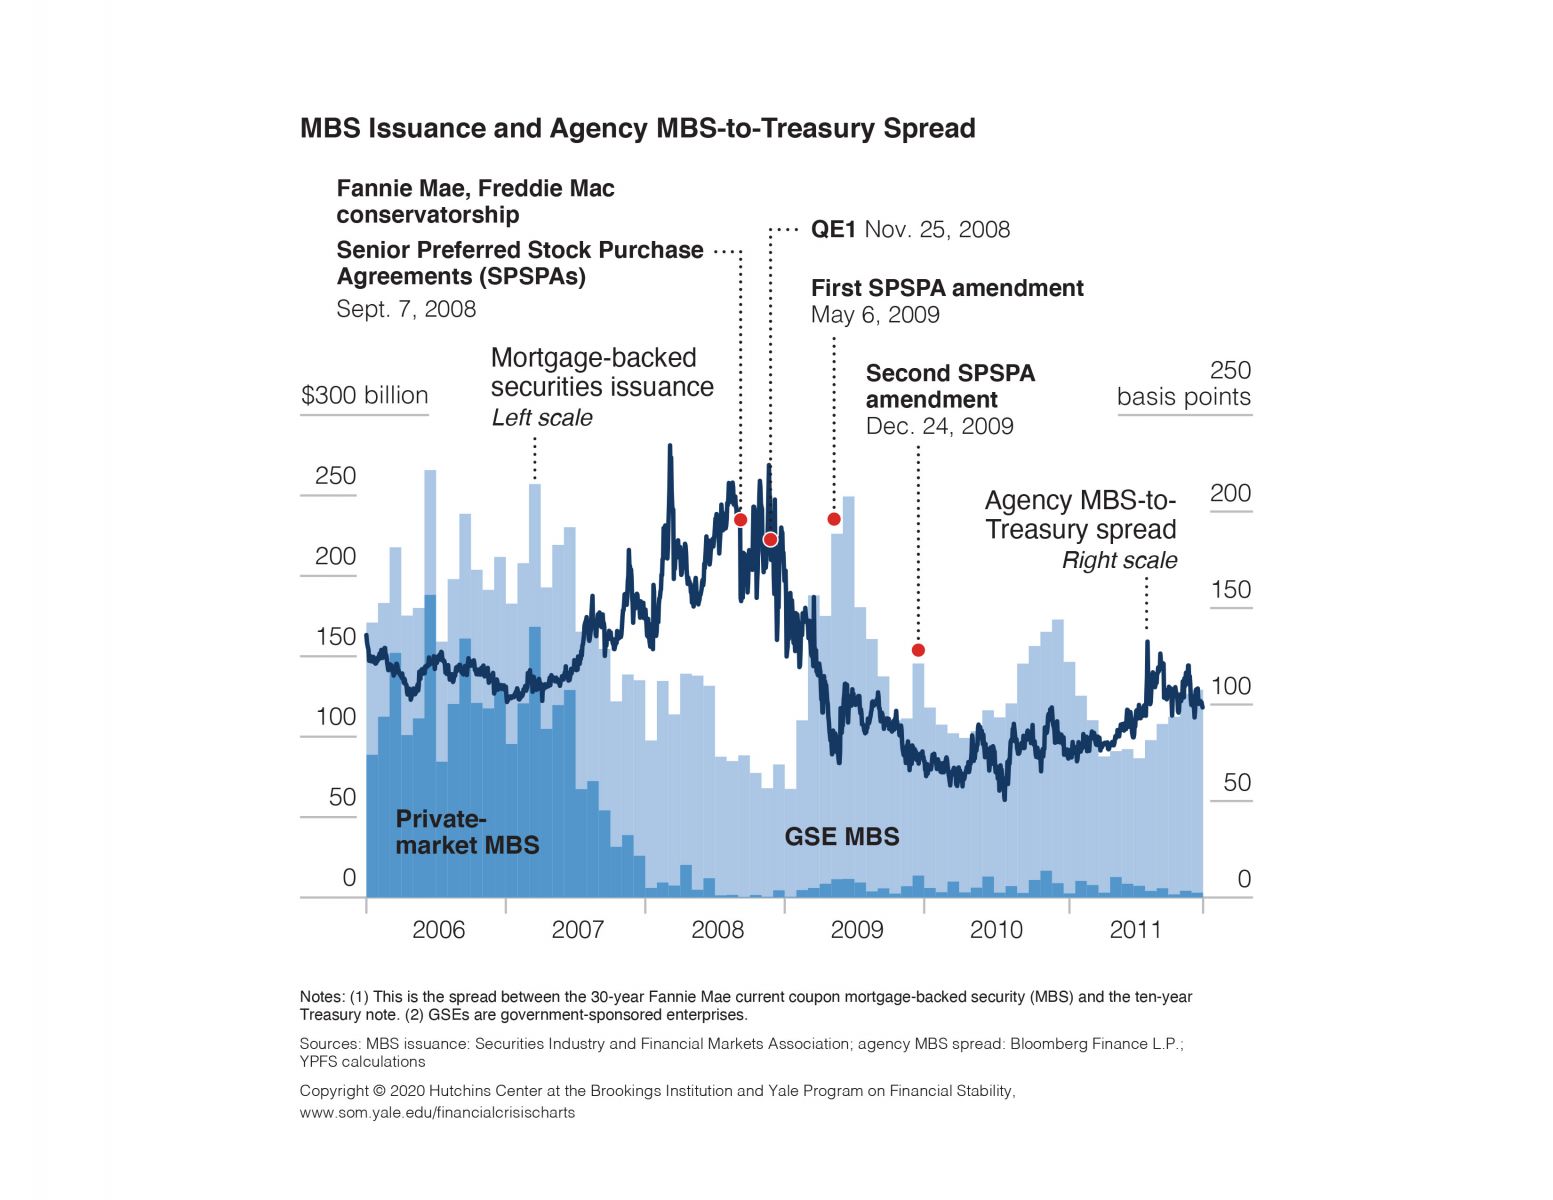
MBS Issuance, Agency MBS-to-Treasury Spread, and Selected Events, 2006–2011
Housing
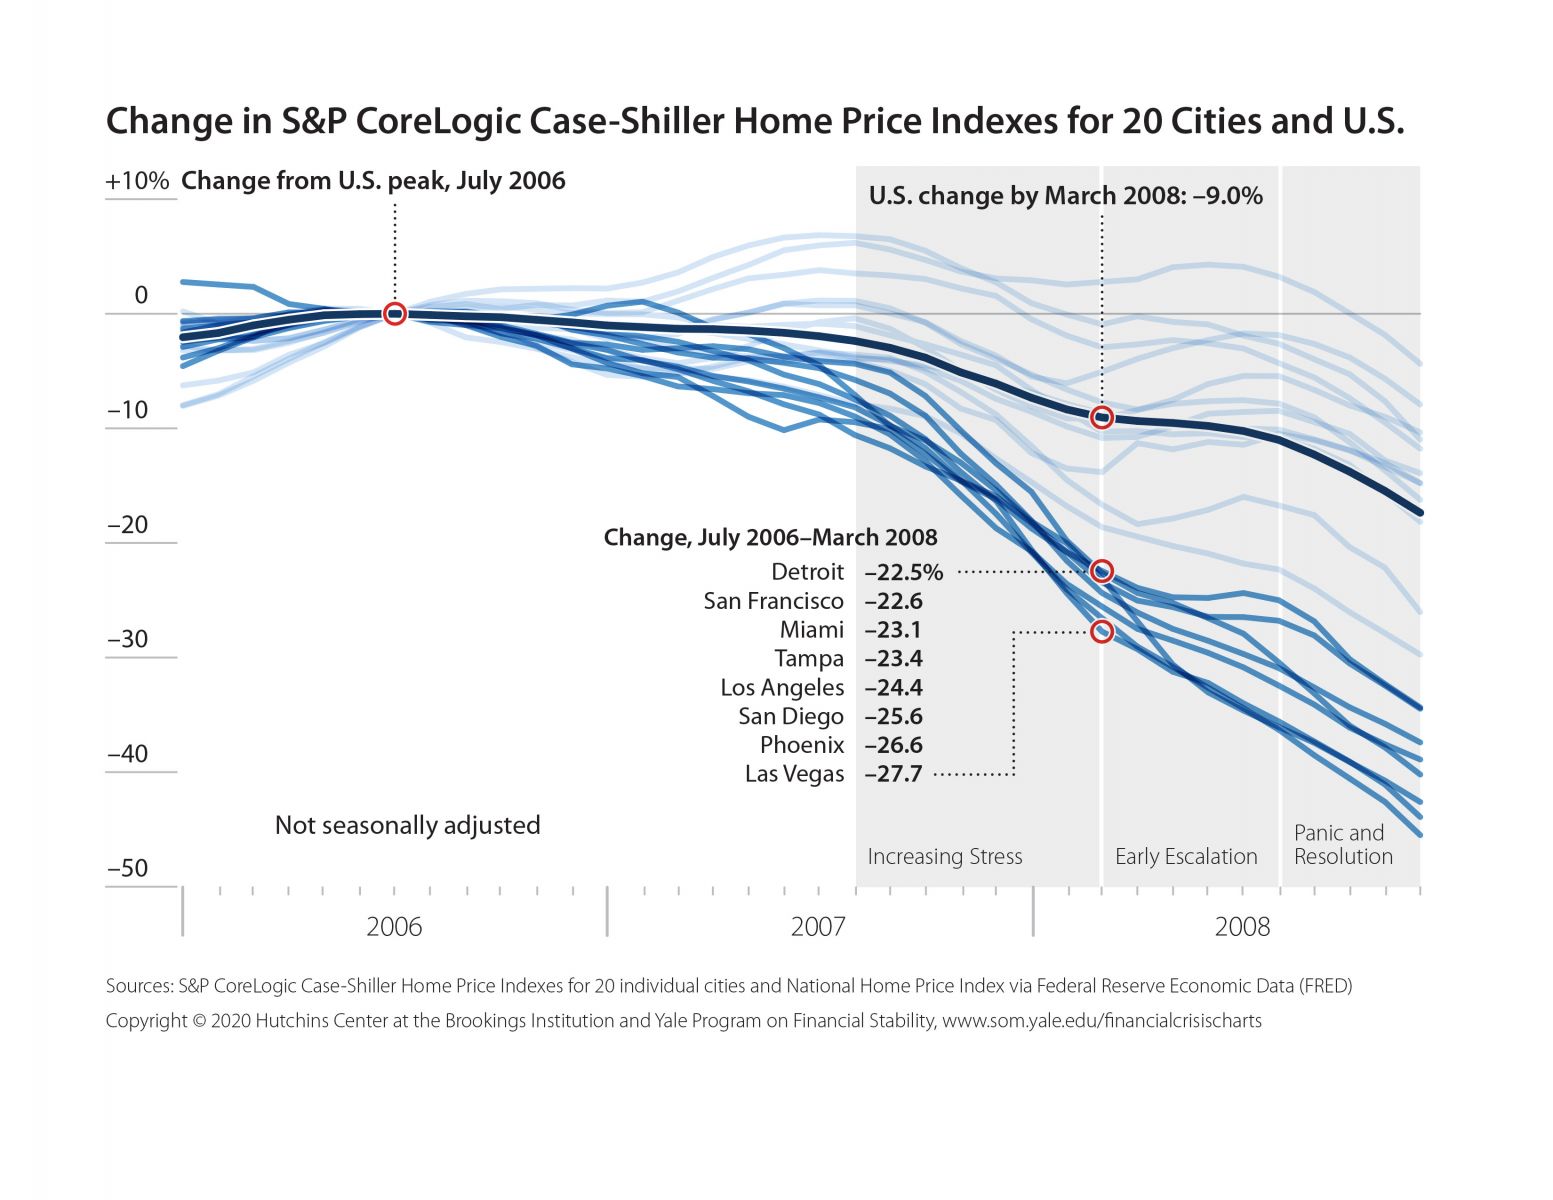
Change in S&P CoreLogic Case-Shiller Home Price Indexes for 20 Cities and U.S., 2006–2008
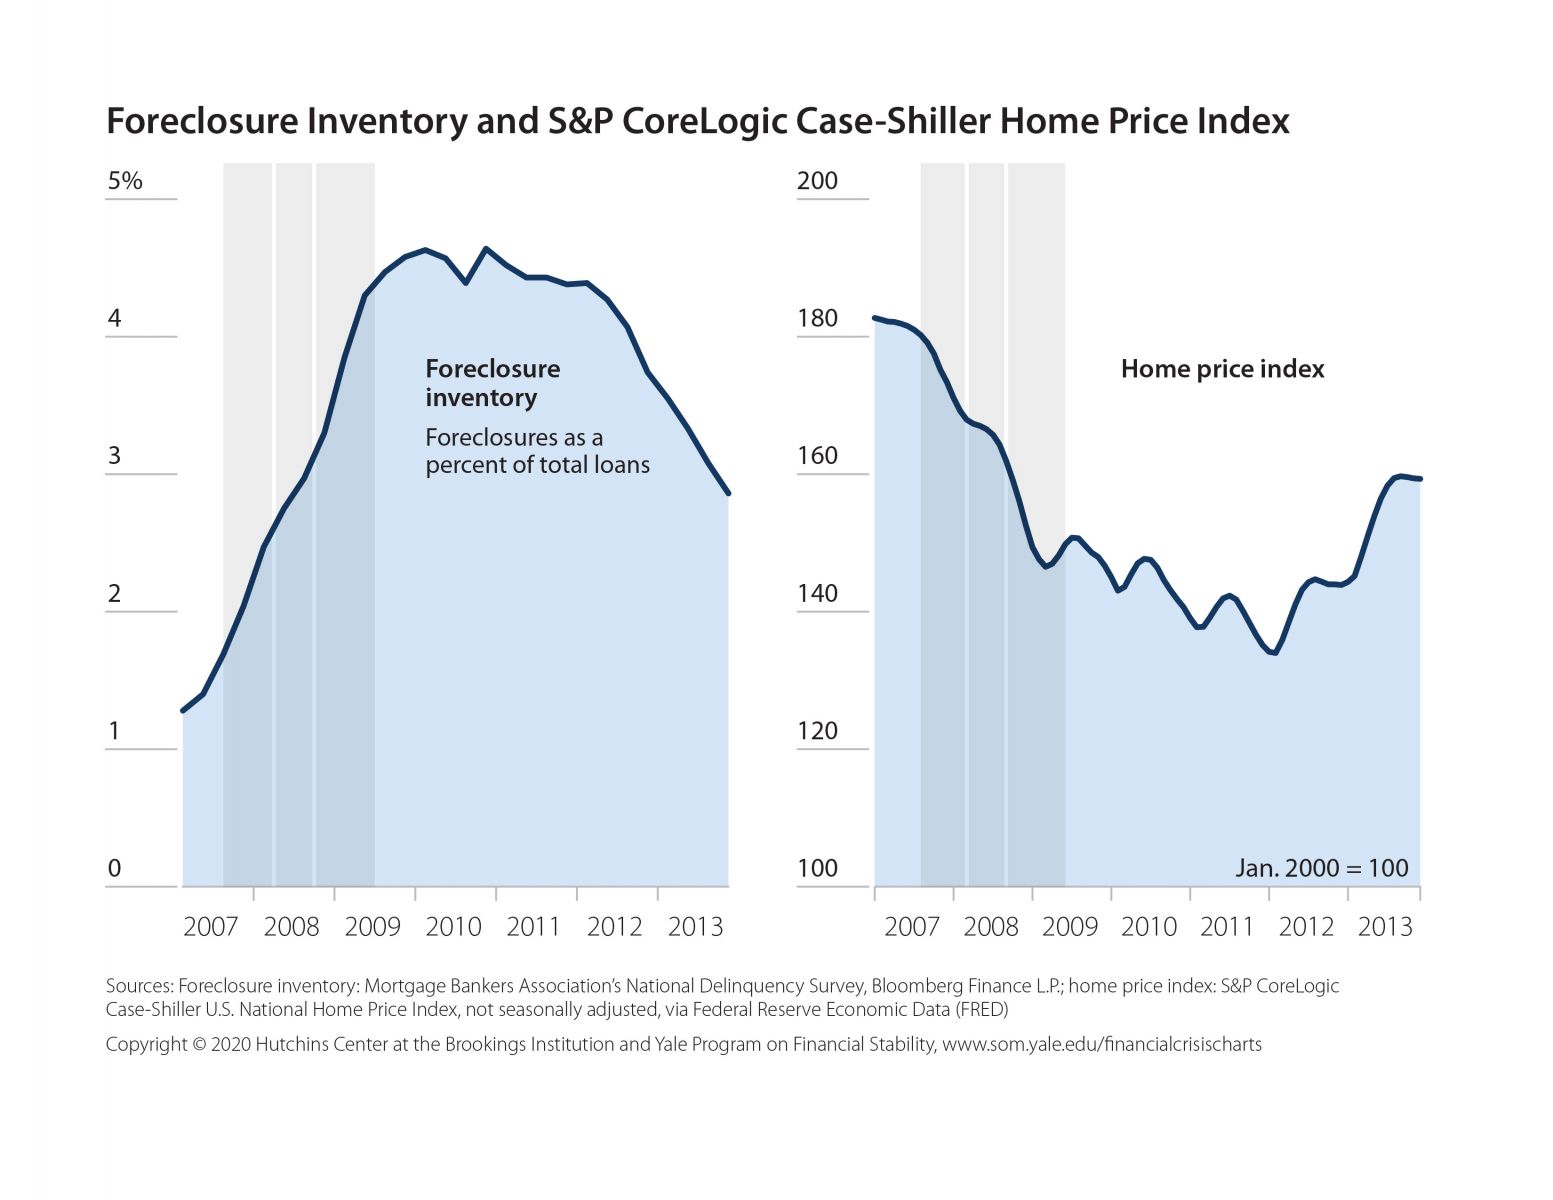
Foreclosure Inventory and S&P CoreLogic Case-Shiller Home Price Index, 2007–2013
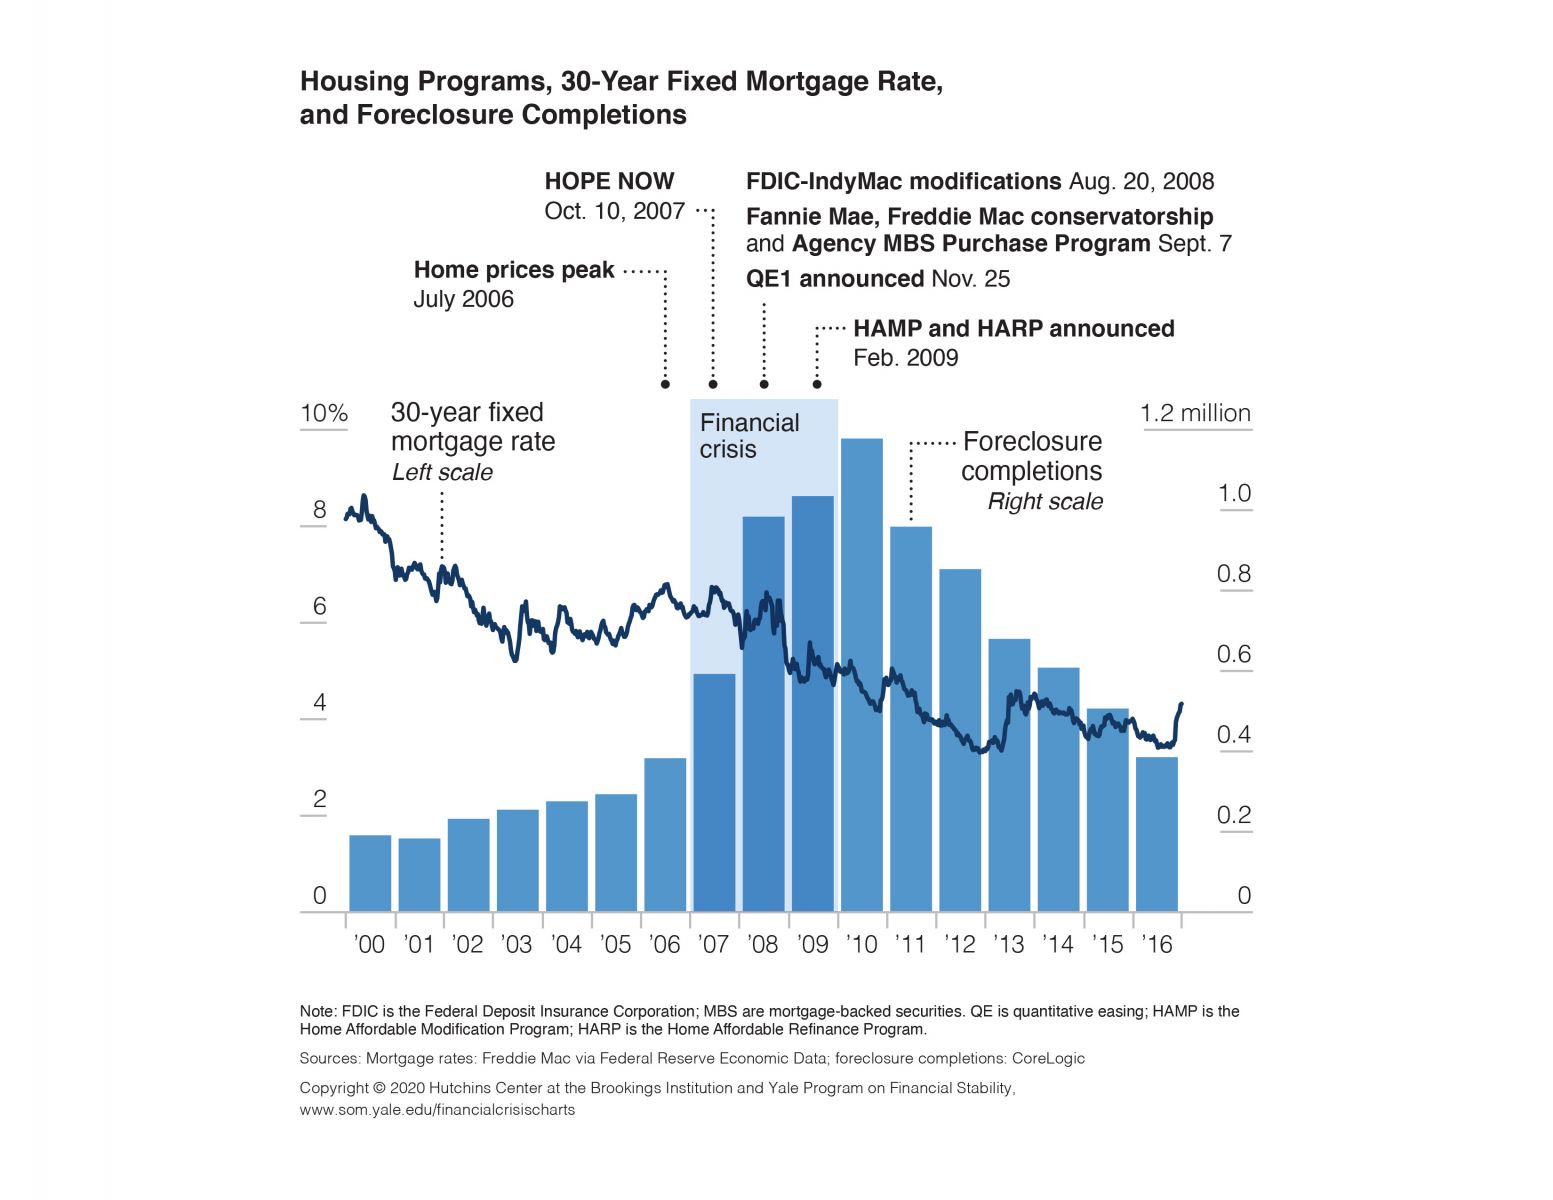
Housing Programs, 30-Year Mortgage Rate, and Foreclosure Completions, 2000–2016
Housing Programs, 30-Year Fixed Mortgage Rate, Foreclosure Completions, and Selected Events, 2000–2016
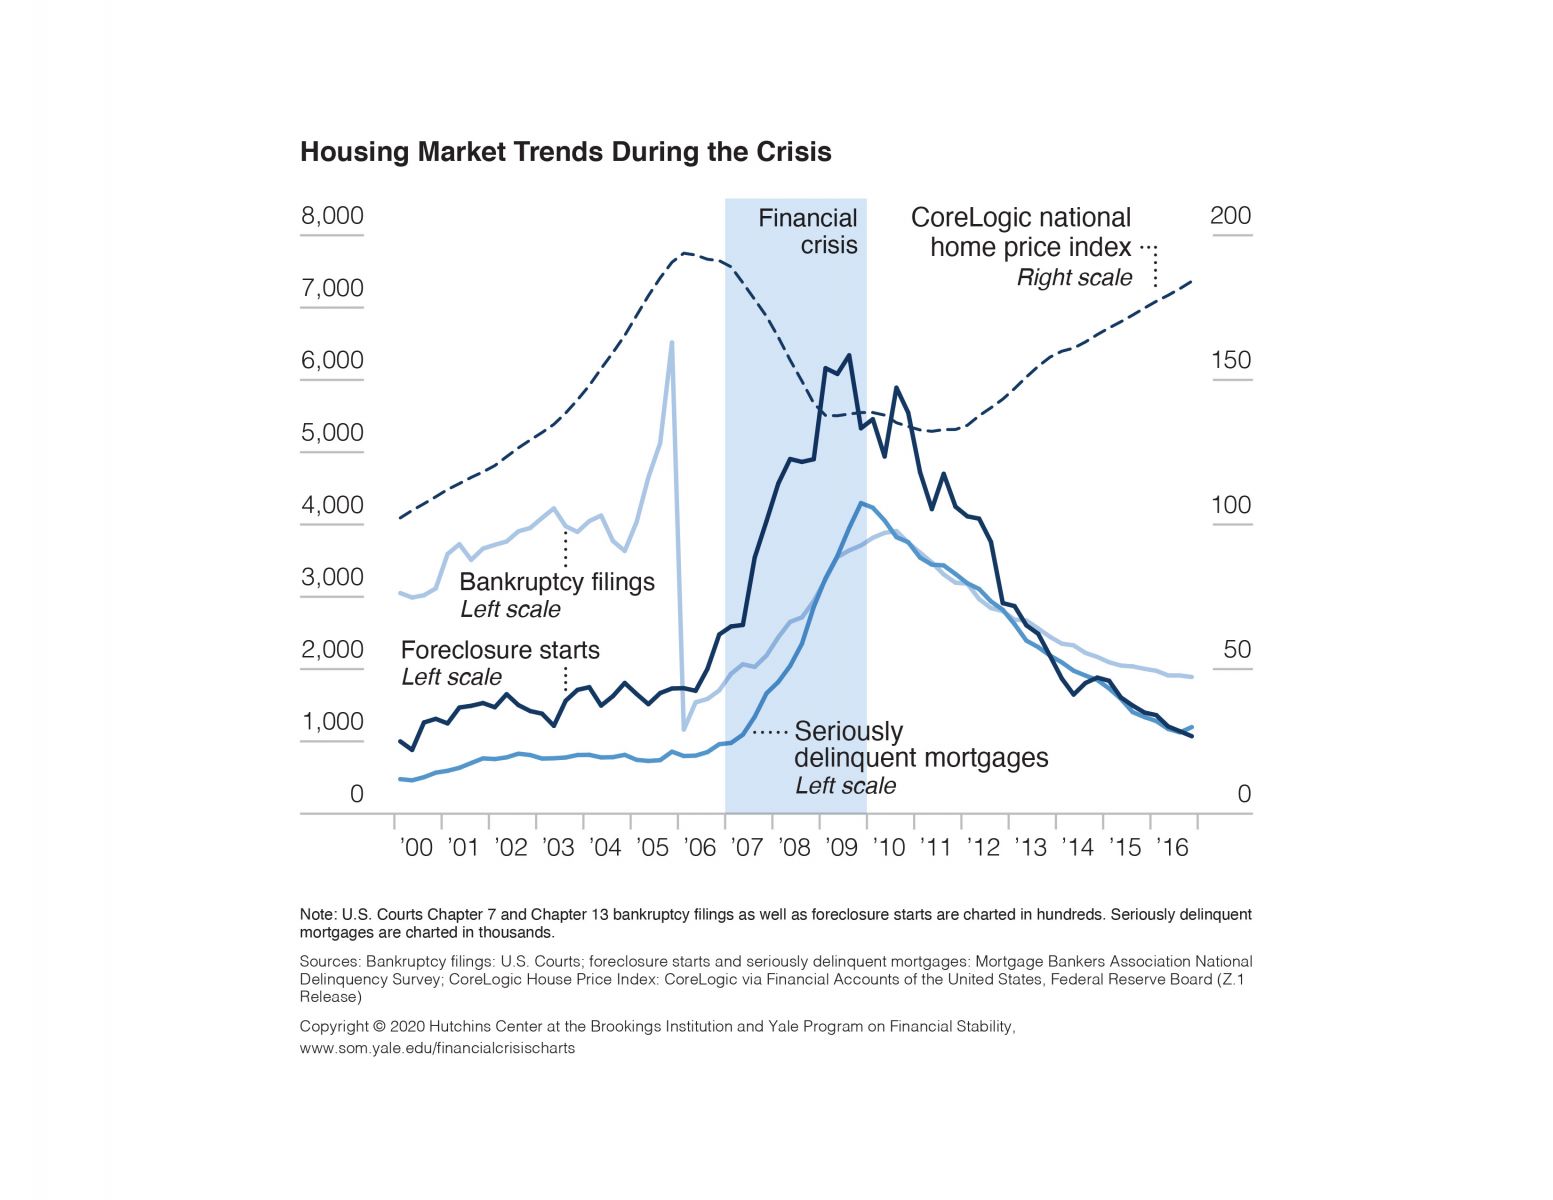
Housing Market Trends during the Crisis
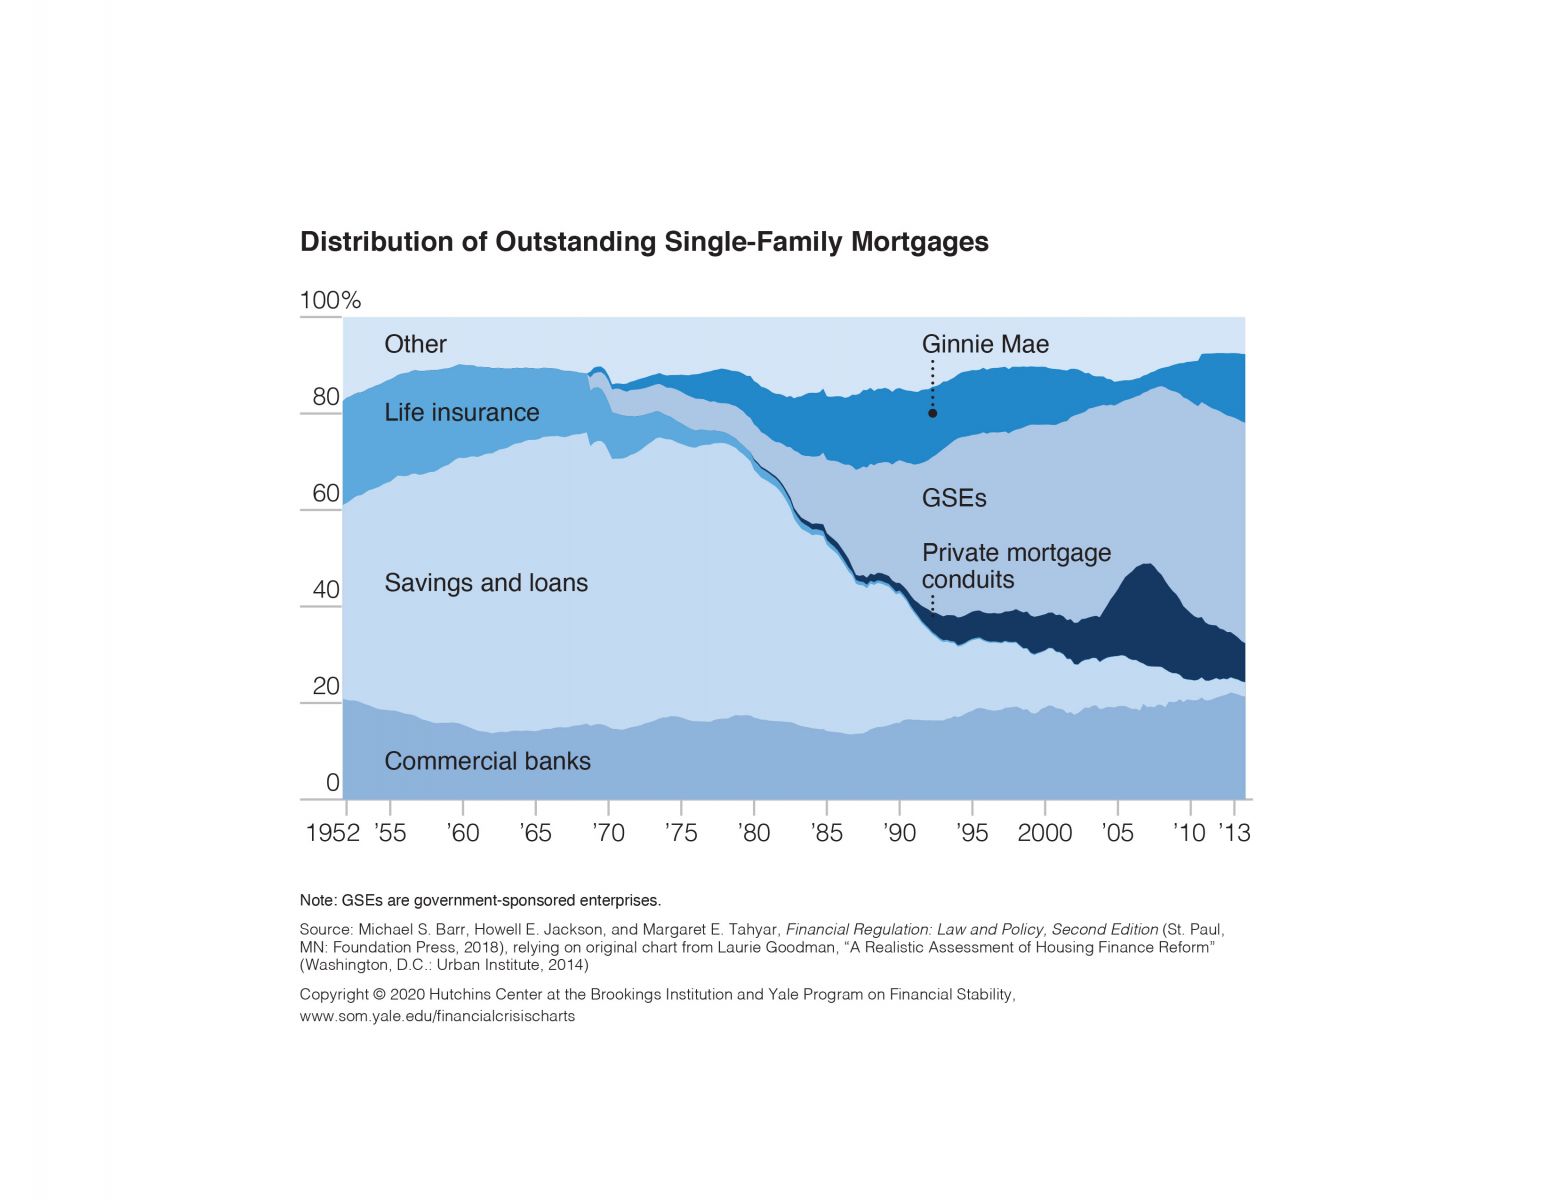
Distribution of Outstanding Single-Family Mortgages, 1952–2013
Housing Programs and Foreclosure Completions, 2005–2016
Loan Modification Programs, Including HAMP, and Foreclosure Completions, 2005–2016
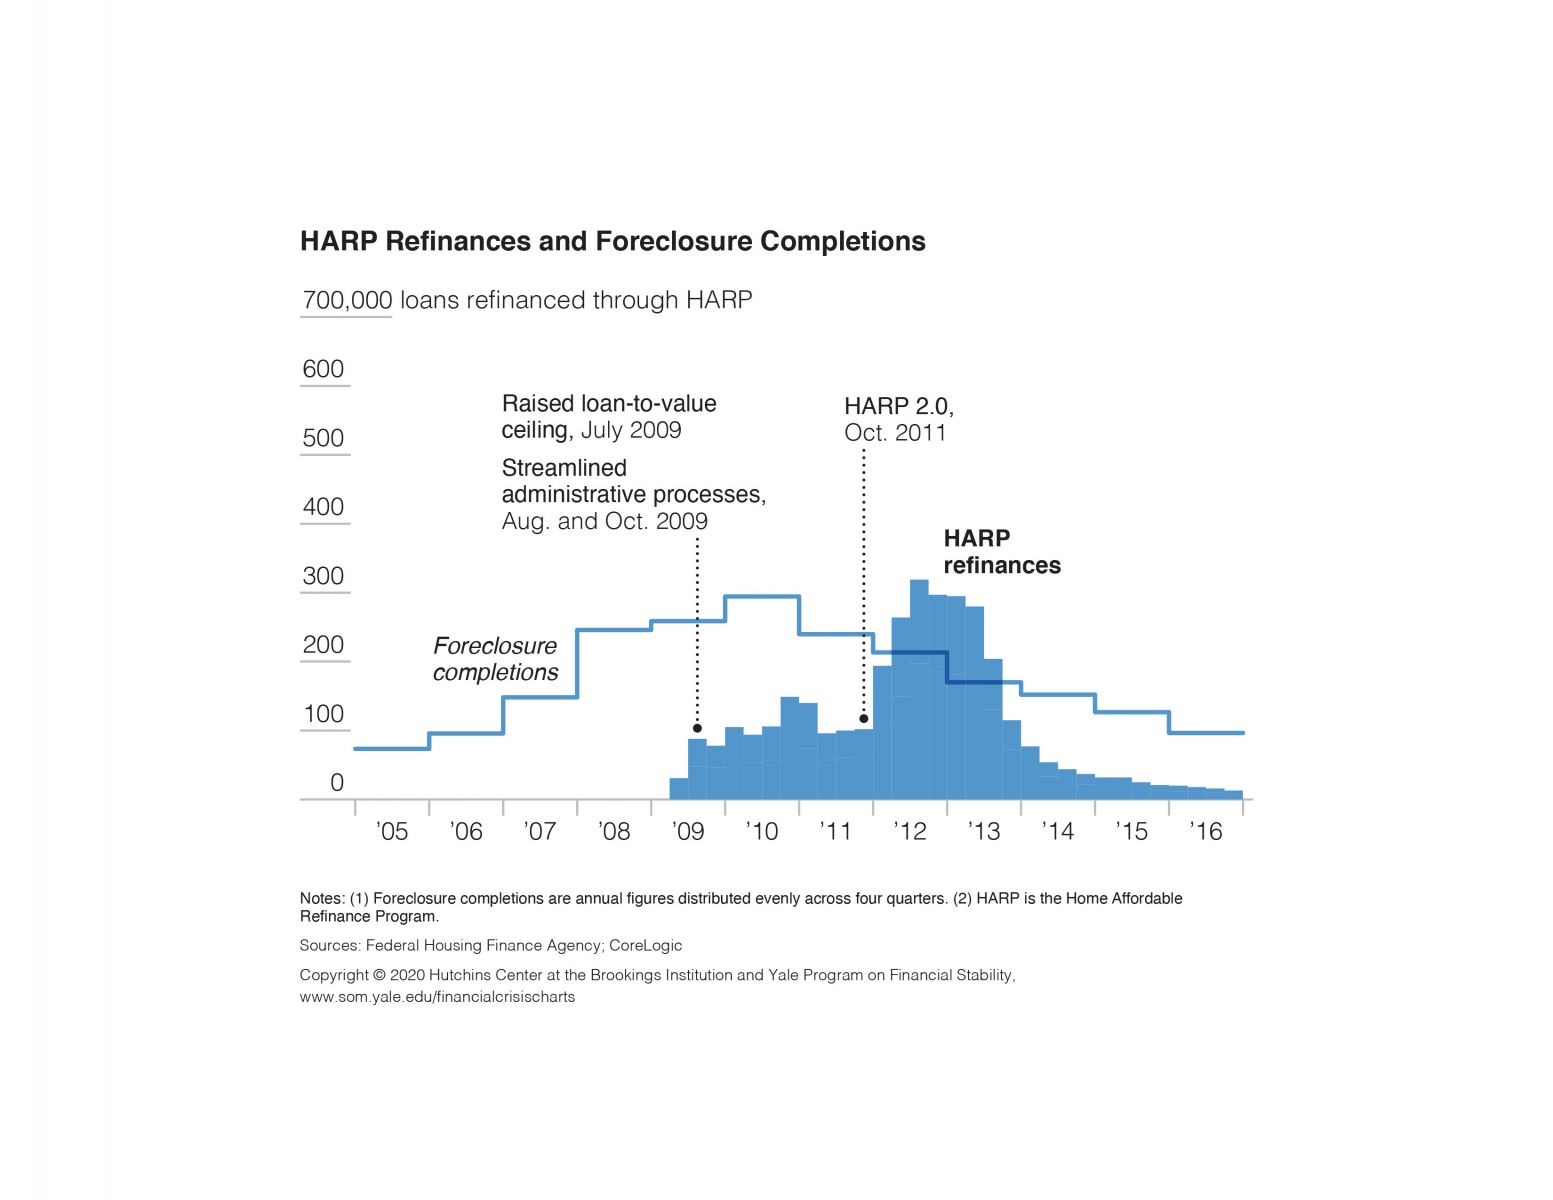
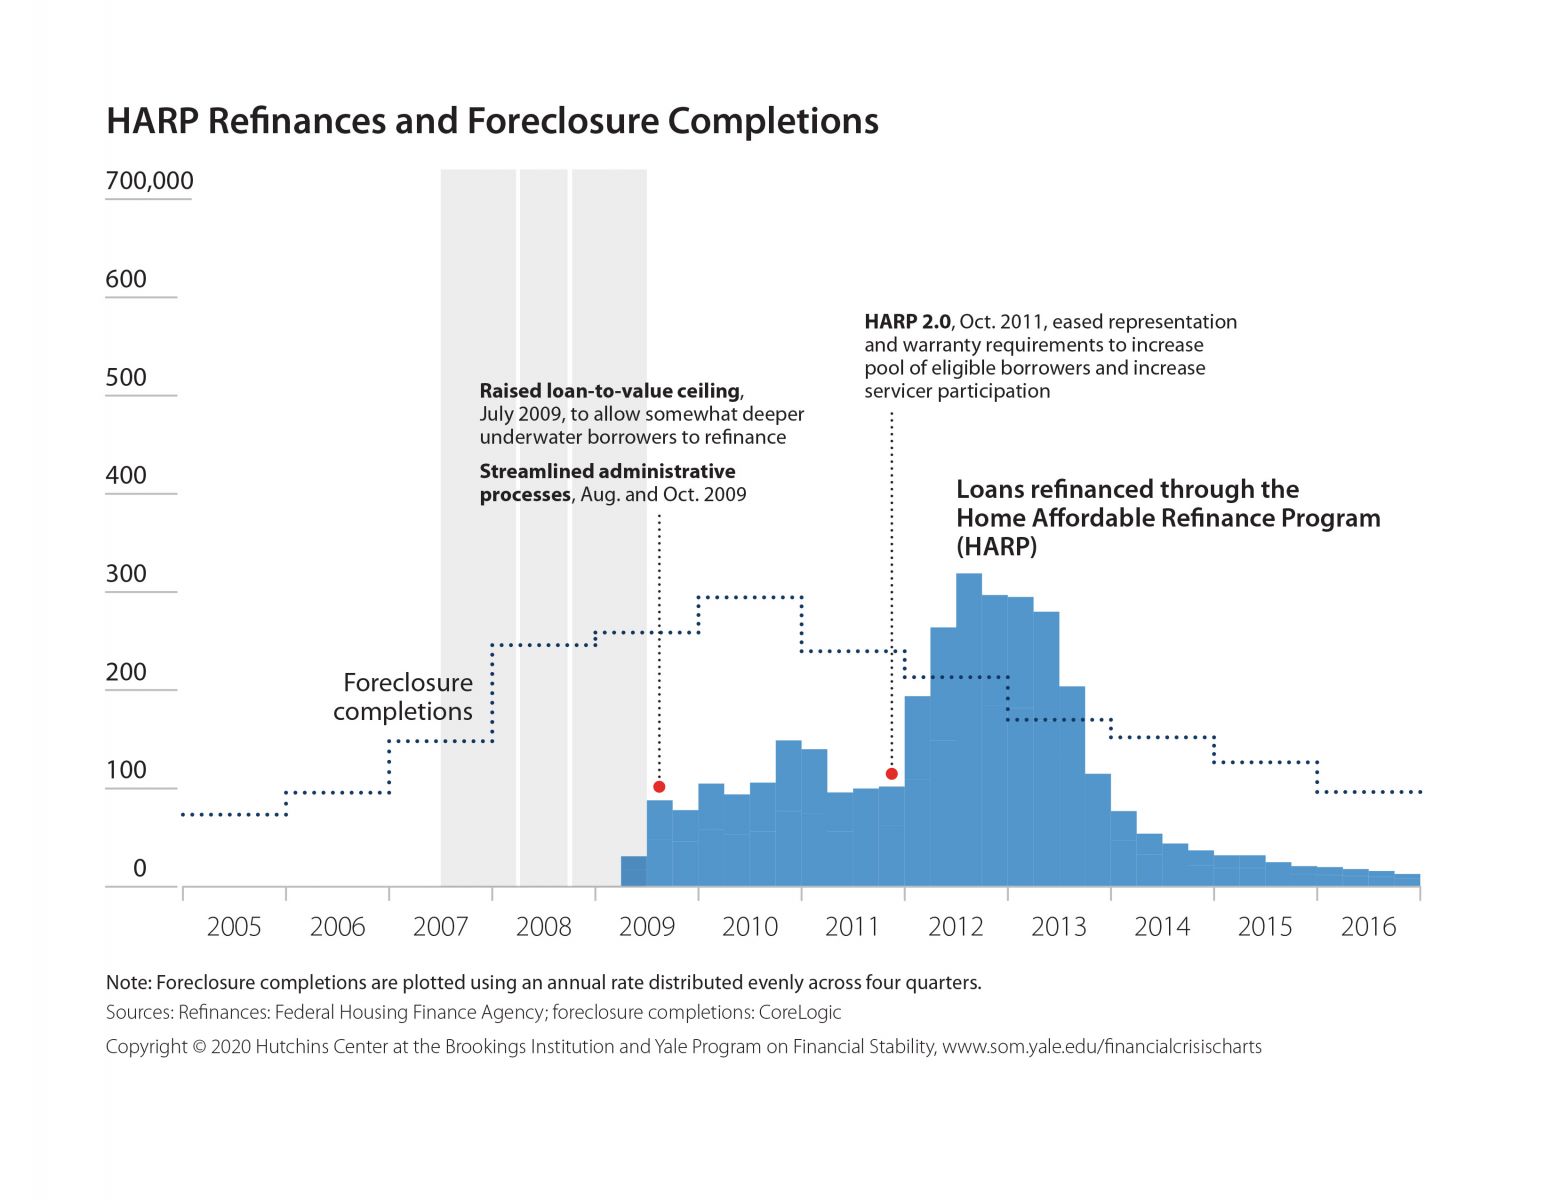
HARP Refinances and Foreclosure Completions, 2005–2016
HARP Refinances and Foreclosure Completions, 2005–2016
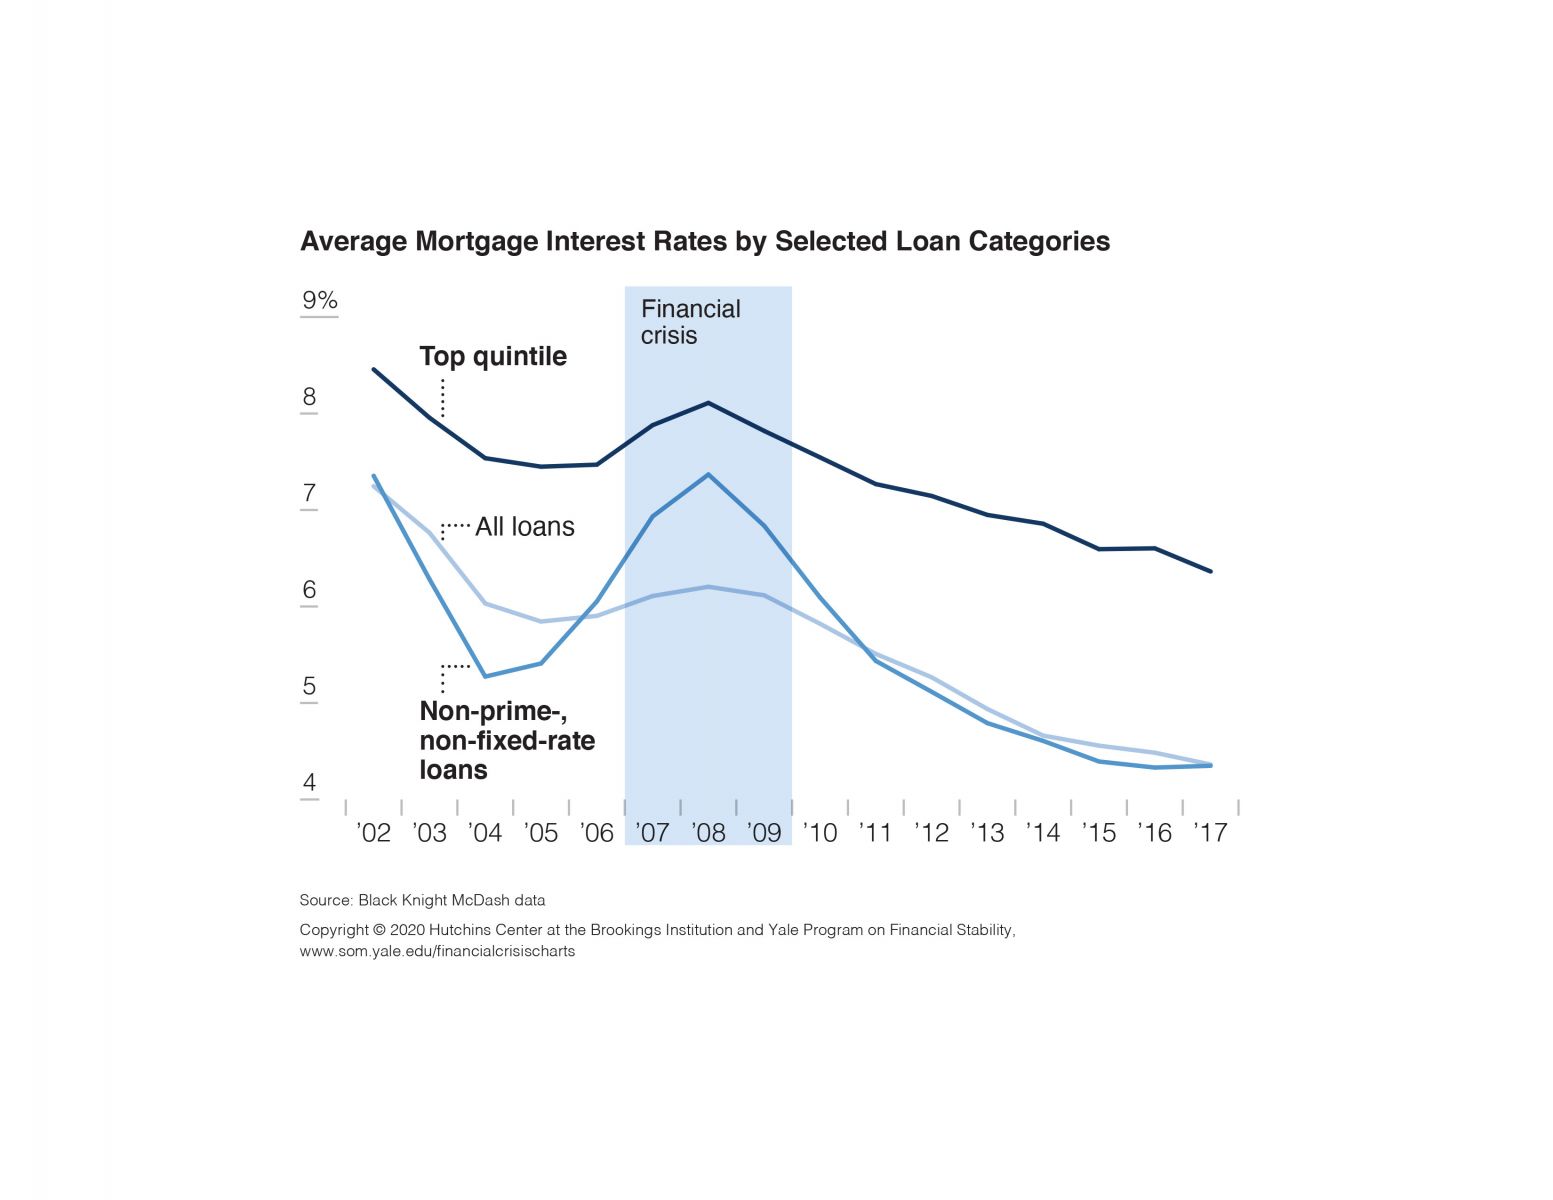
Average Mortgage Interest Rate, 2002-2017, by Selected Loan Categories
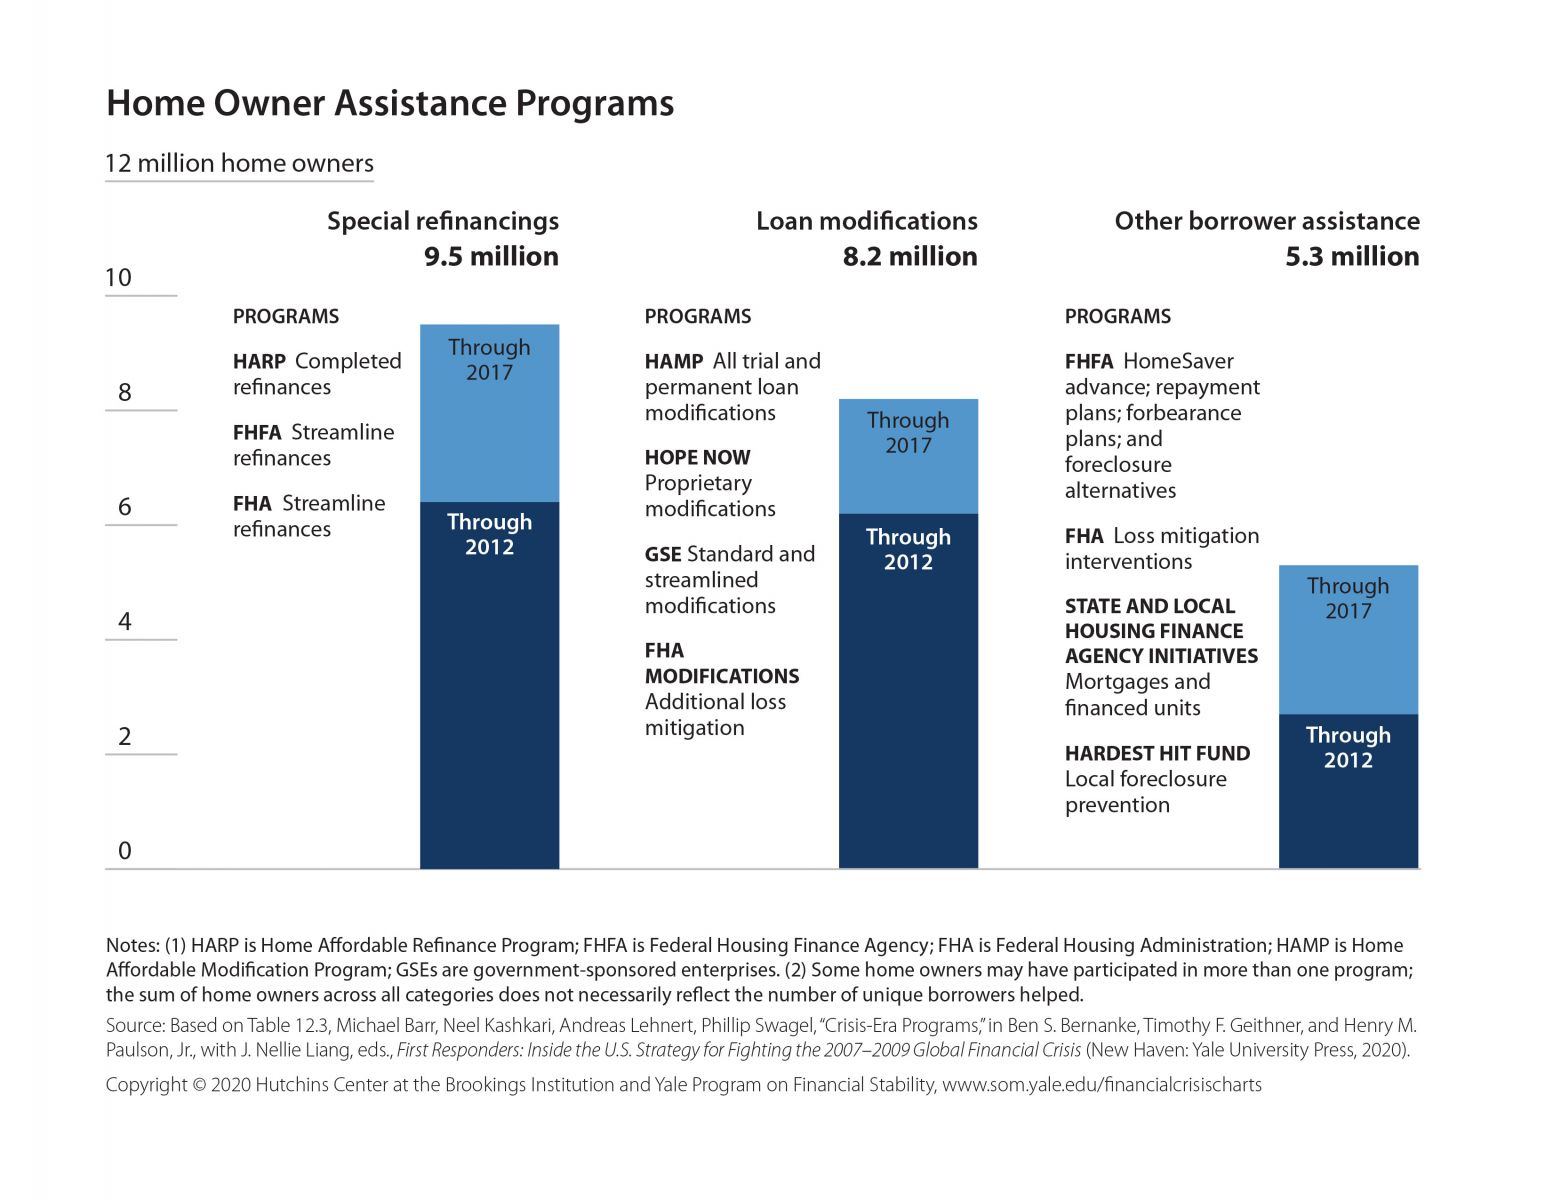
Home Owner Assistance Programs (through 2012 and 2017)
International
International
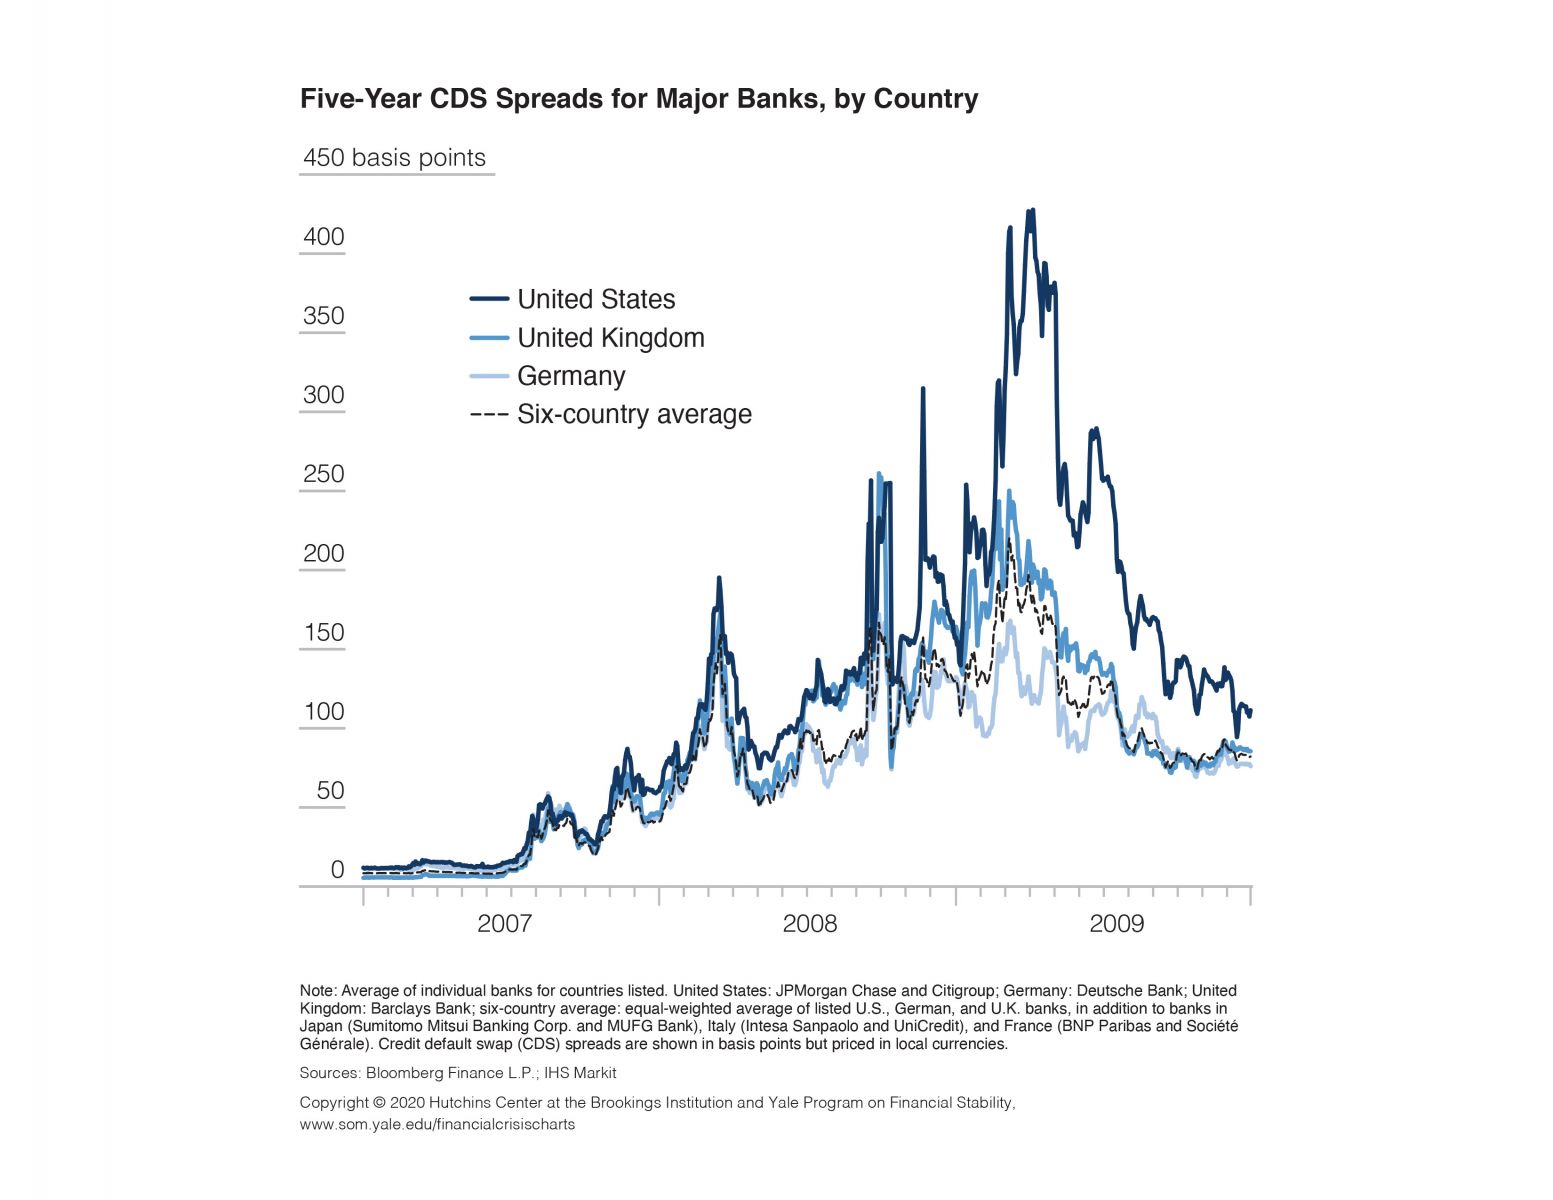
Five-Year Credit Default Swap Spreads for Major Banks, by Country, 2007–2009
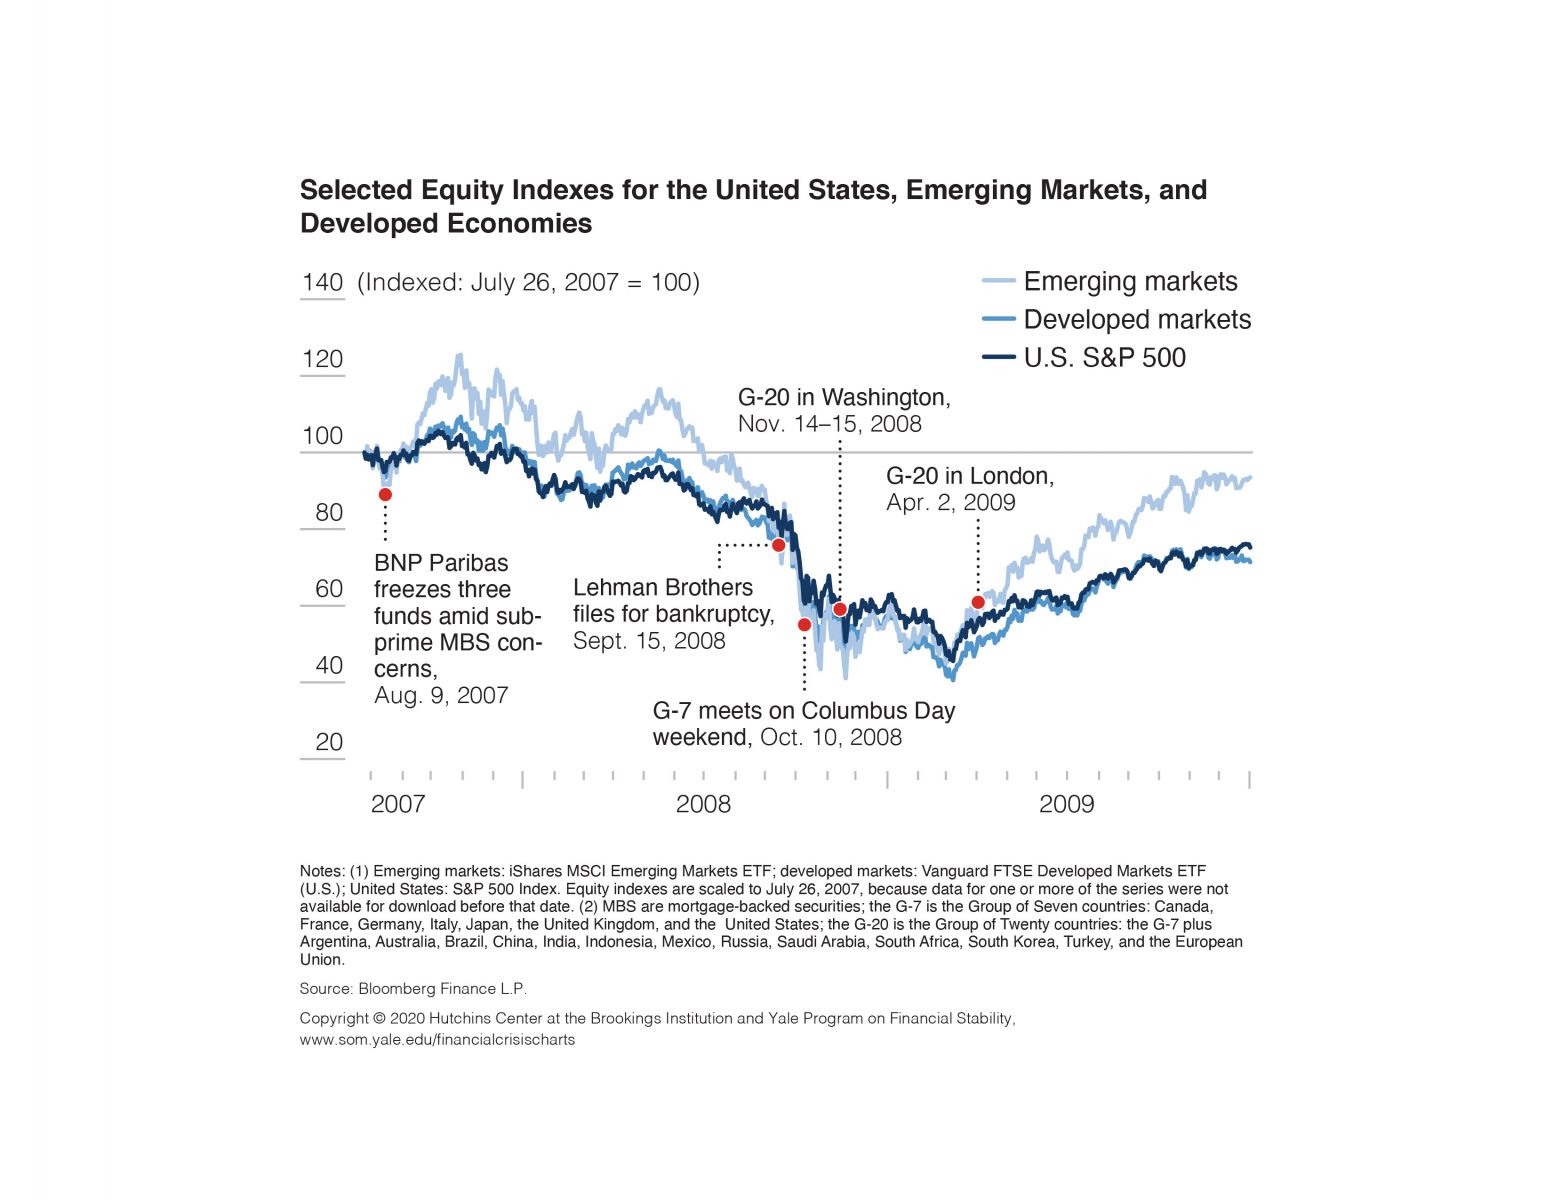
Selected Equity Indexes for the U.S., Emerging Markets, and Developed Economies, 2007–2009
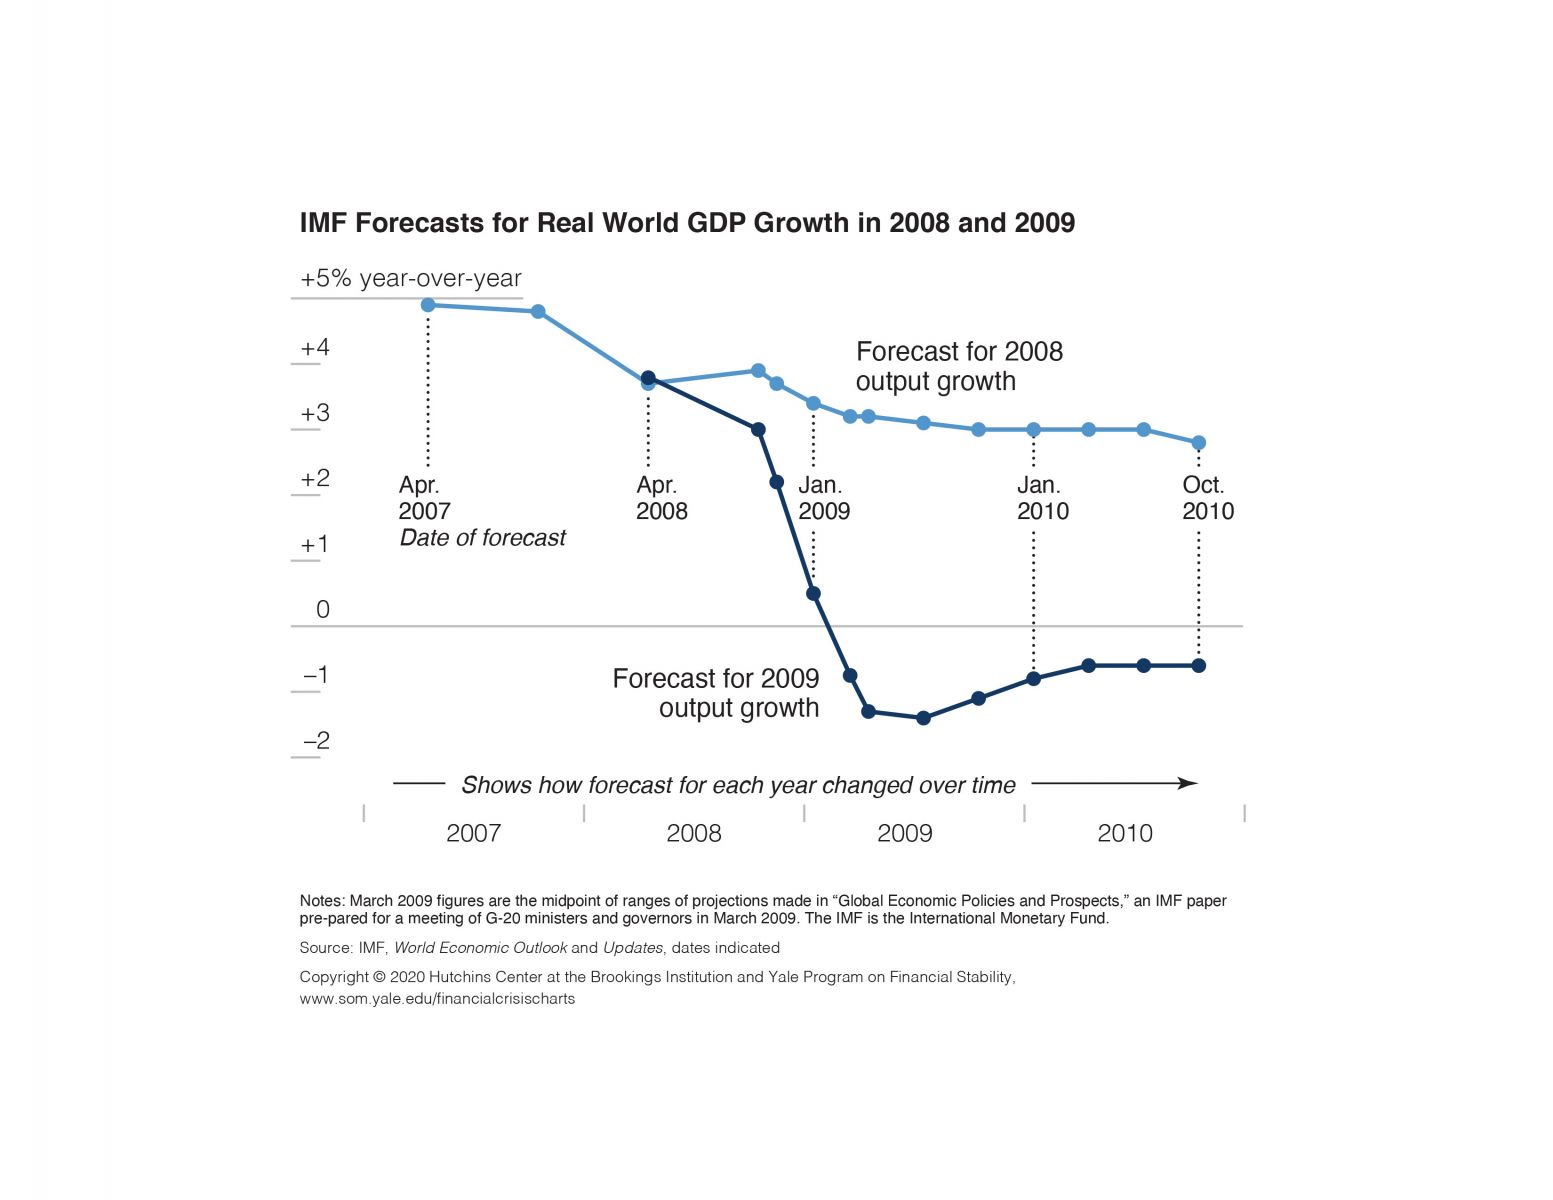
IMF Forecasts for Real-World GDP Growth in 2008 and 2009
Three-Month Libor-OIS Spread and the G-7 and G-20
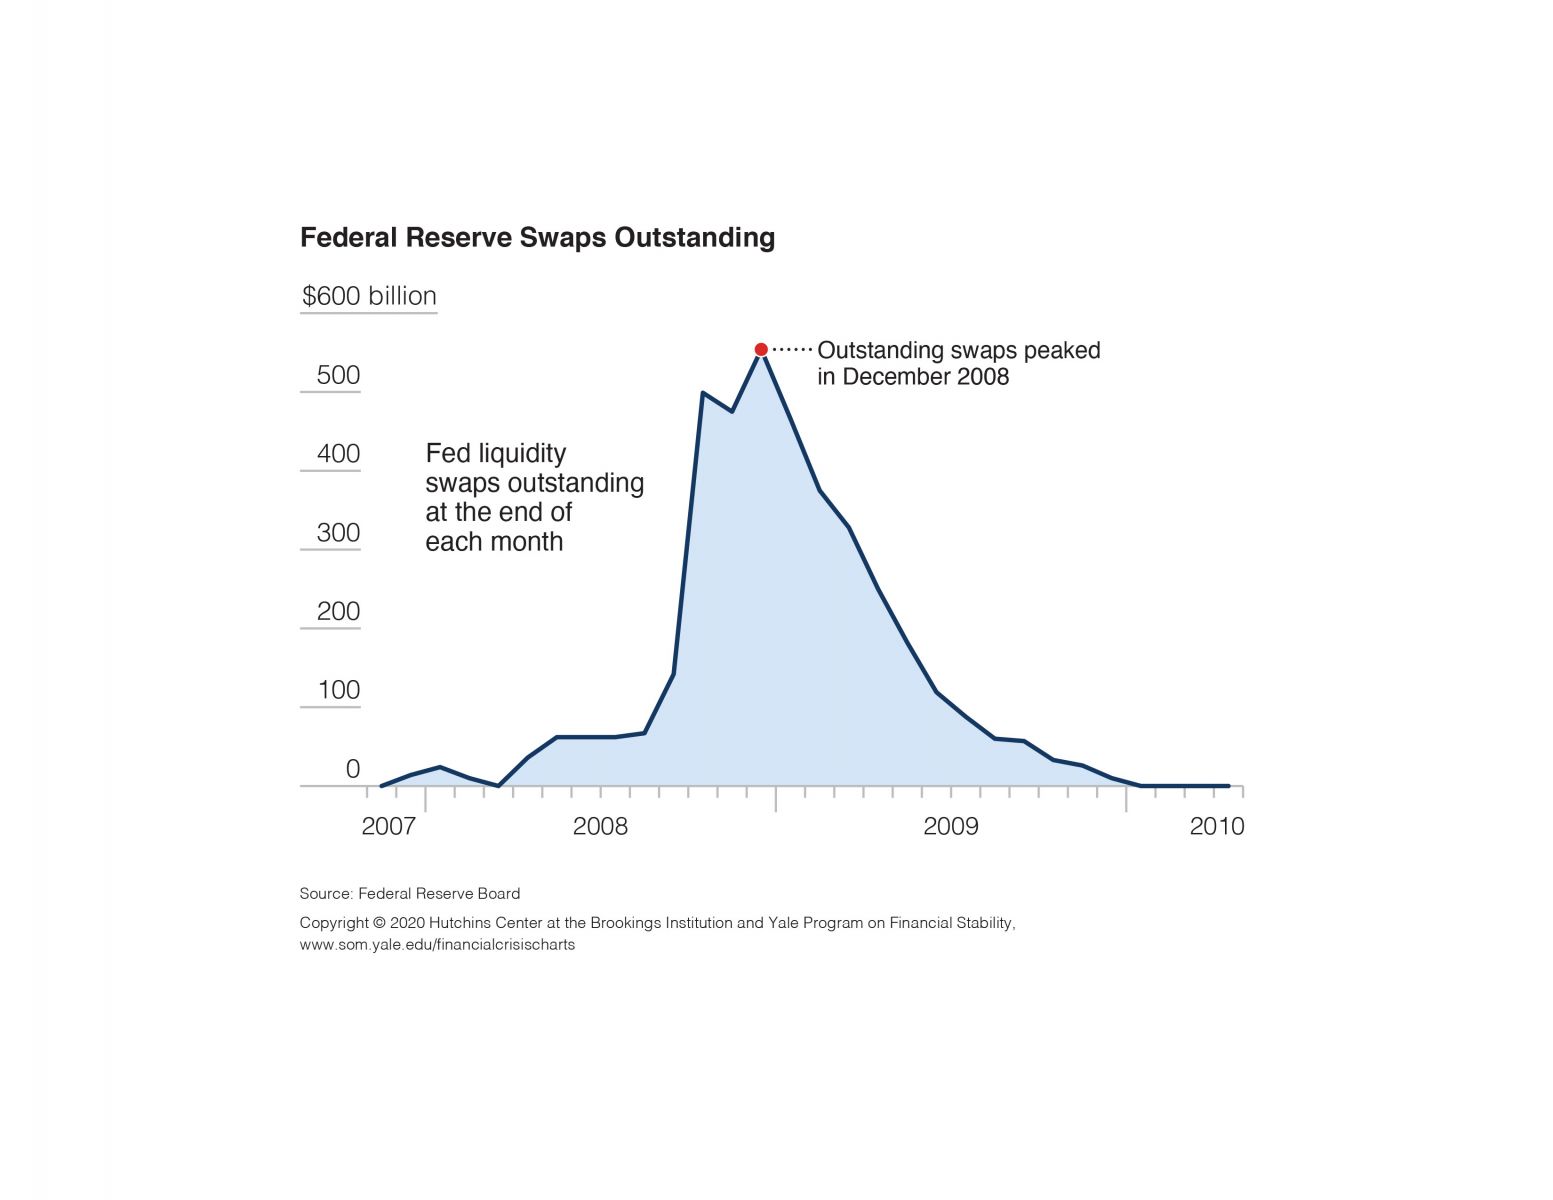
Federal Reserve Swaps Outstanding, 2007–2010
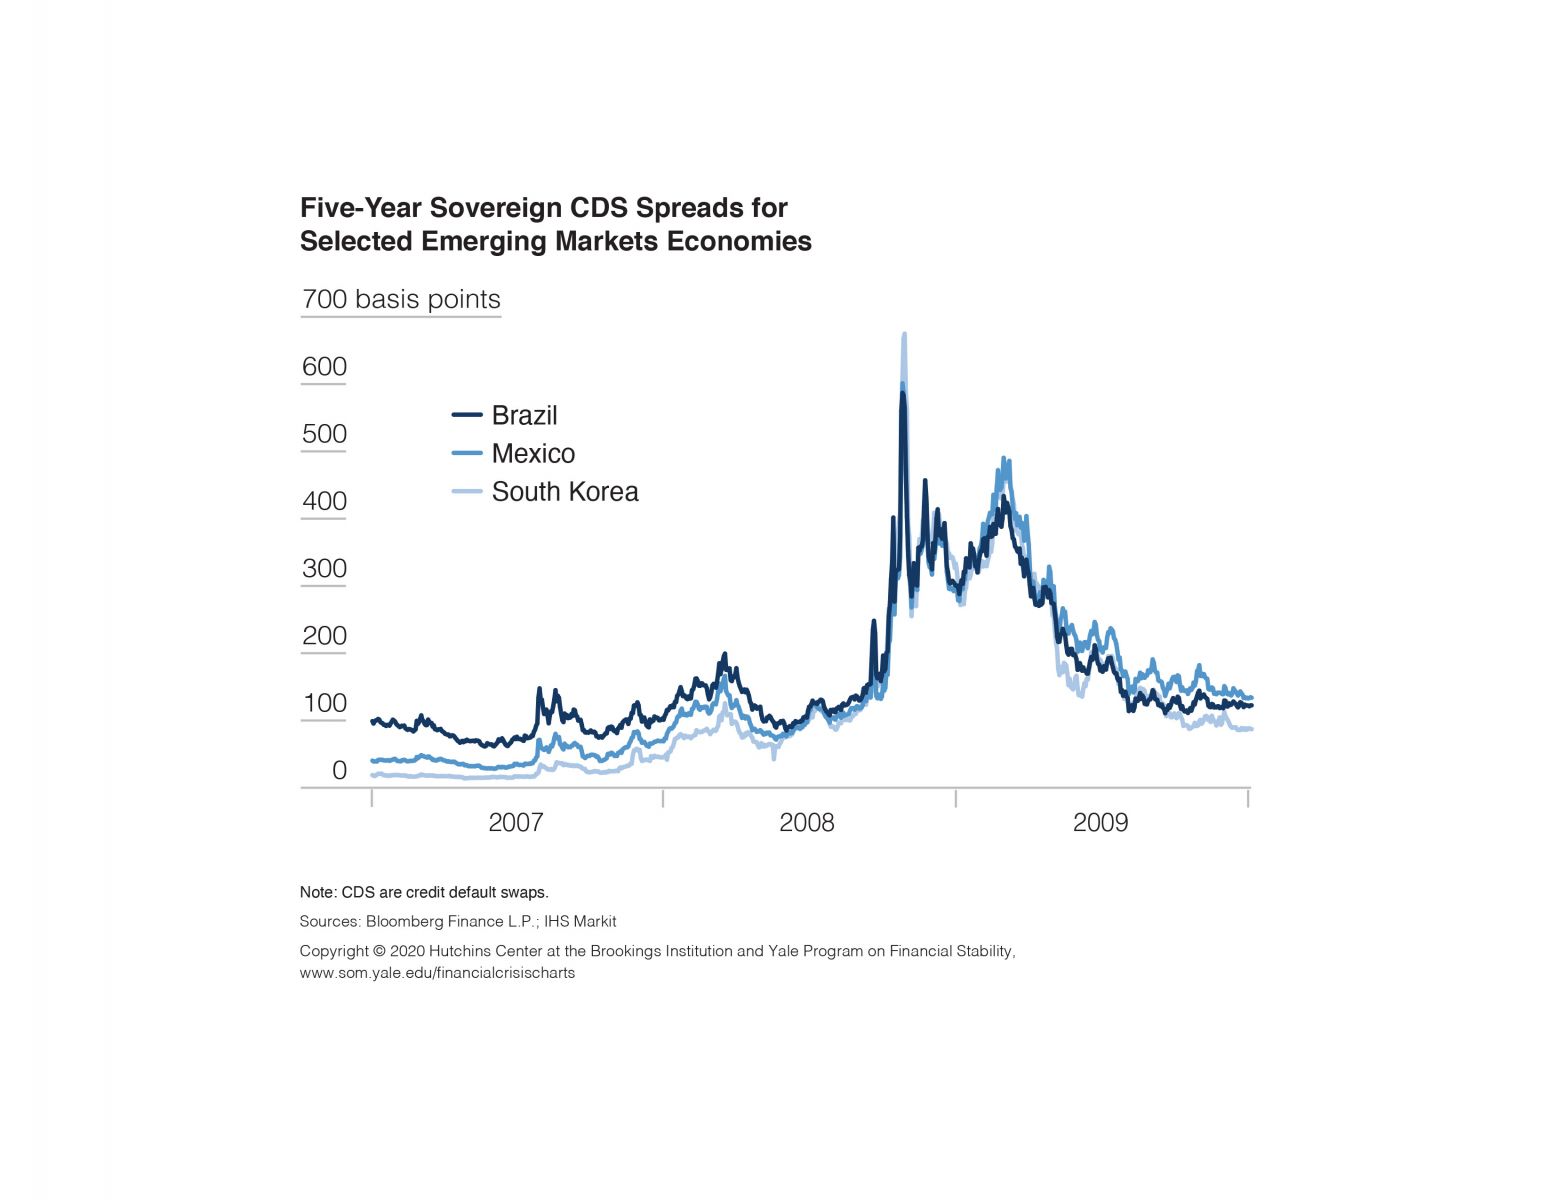
Five-Year Sovereign Credit Default Swaps for Selected Emerging Markets Economies, 2007–2009
Policy Interest Rates for Major Central Banks, 2007–2009
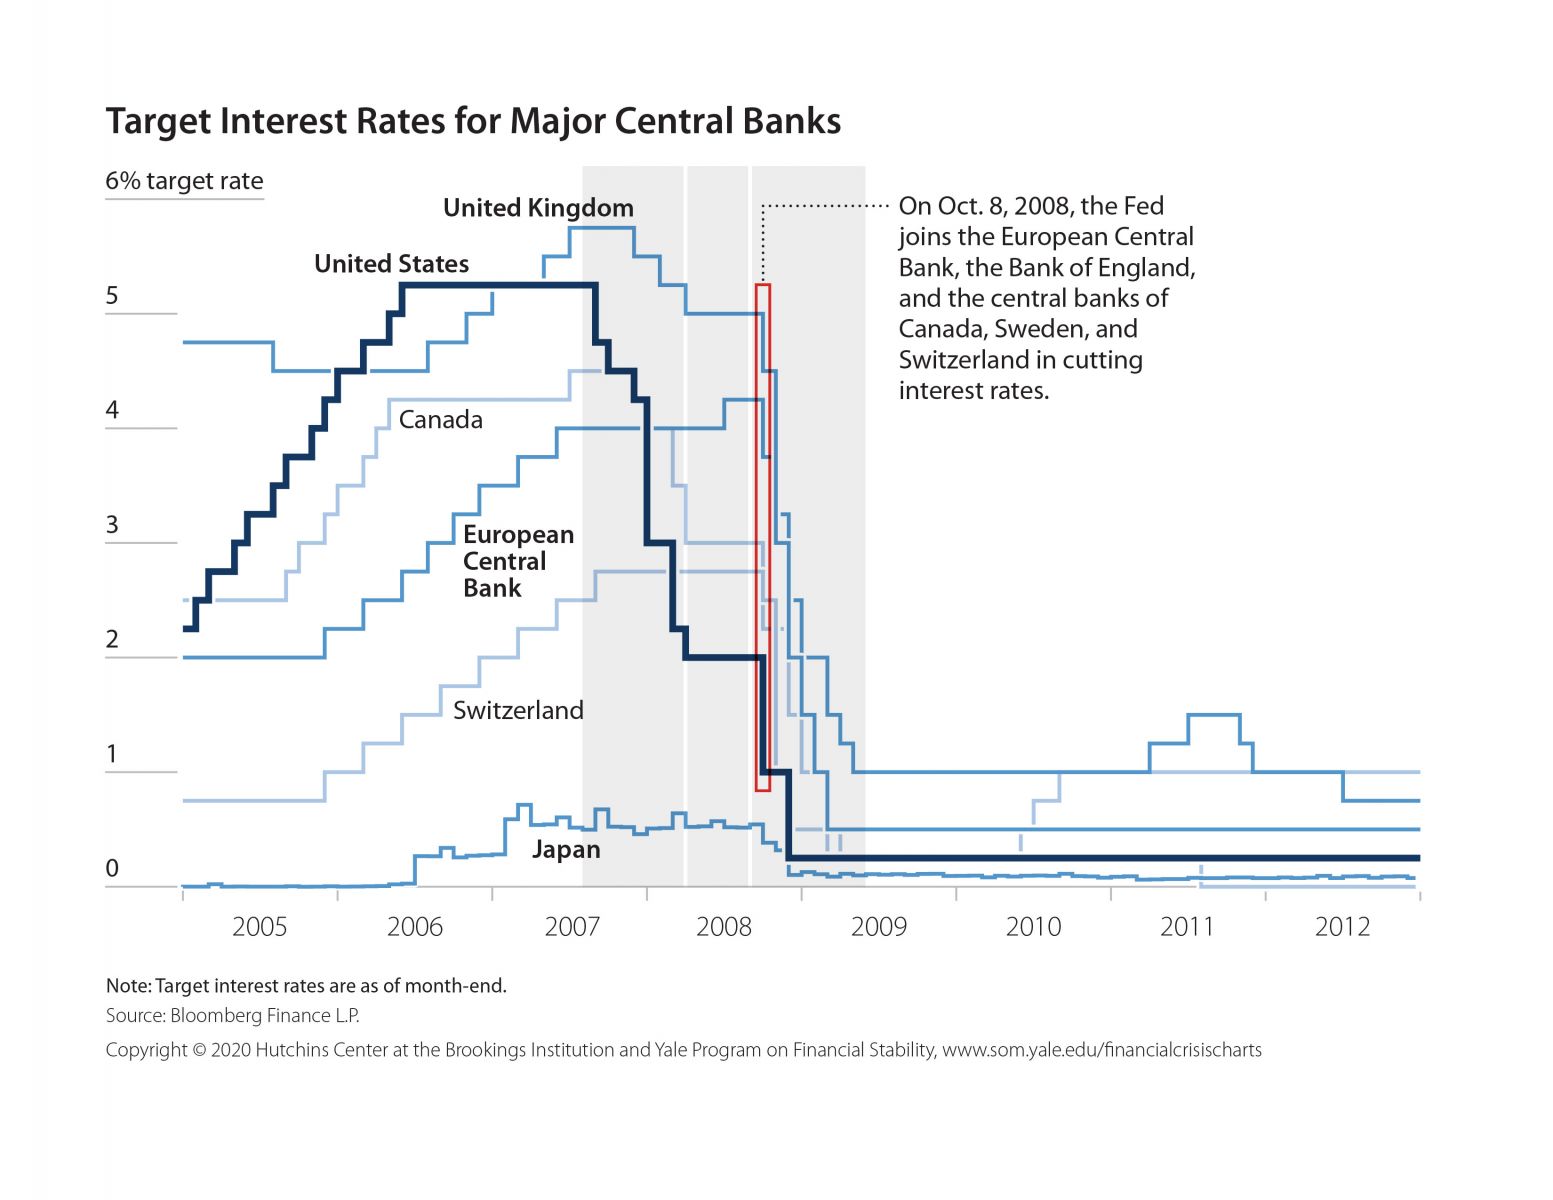
Target Interest Rates for Major Central Banks, 2005–2012
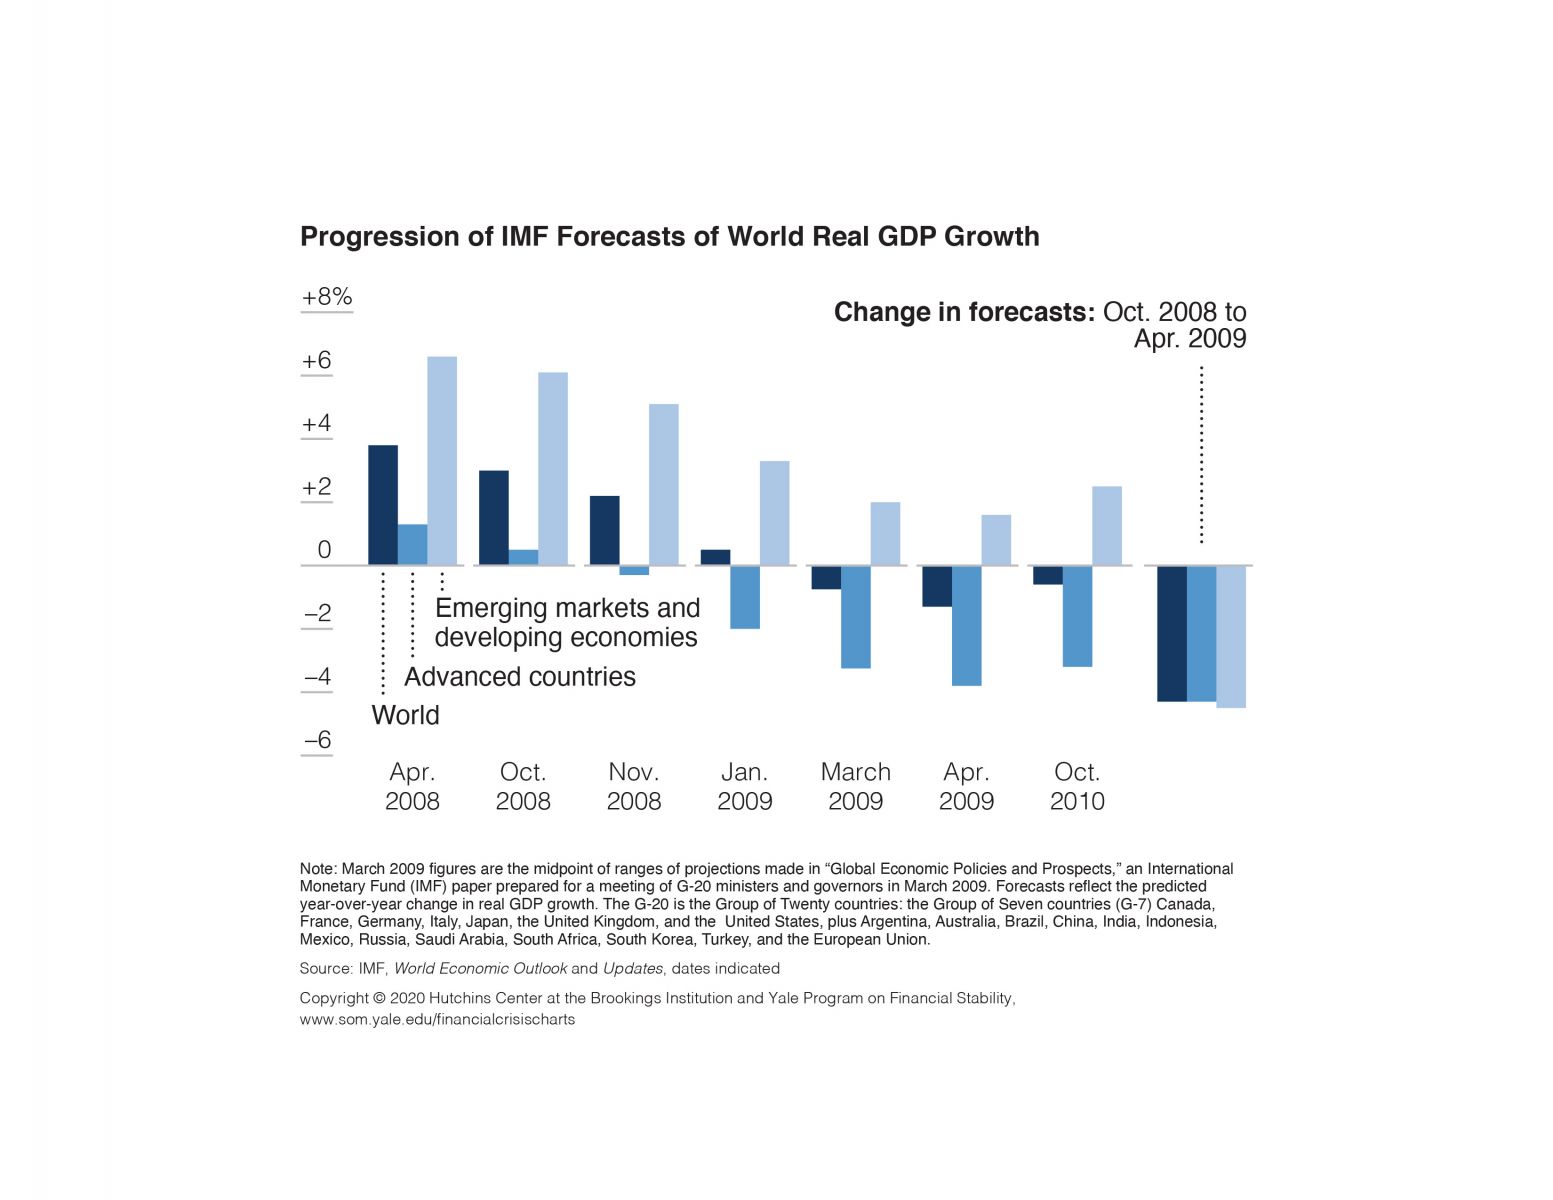
Progression of IMF Forecasts of World Real GDP Growth, April 2008–October 2010
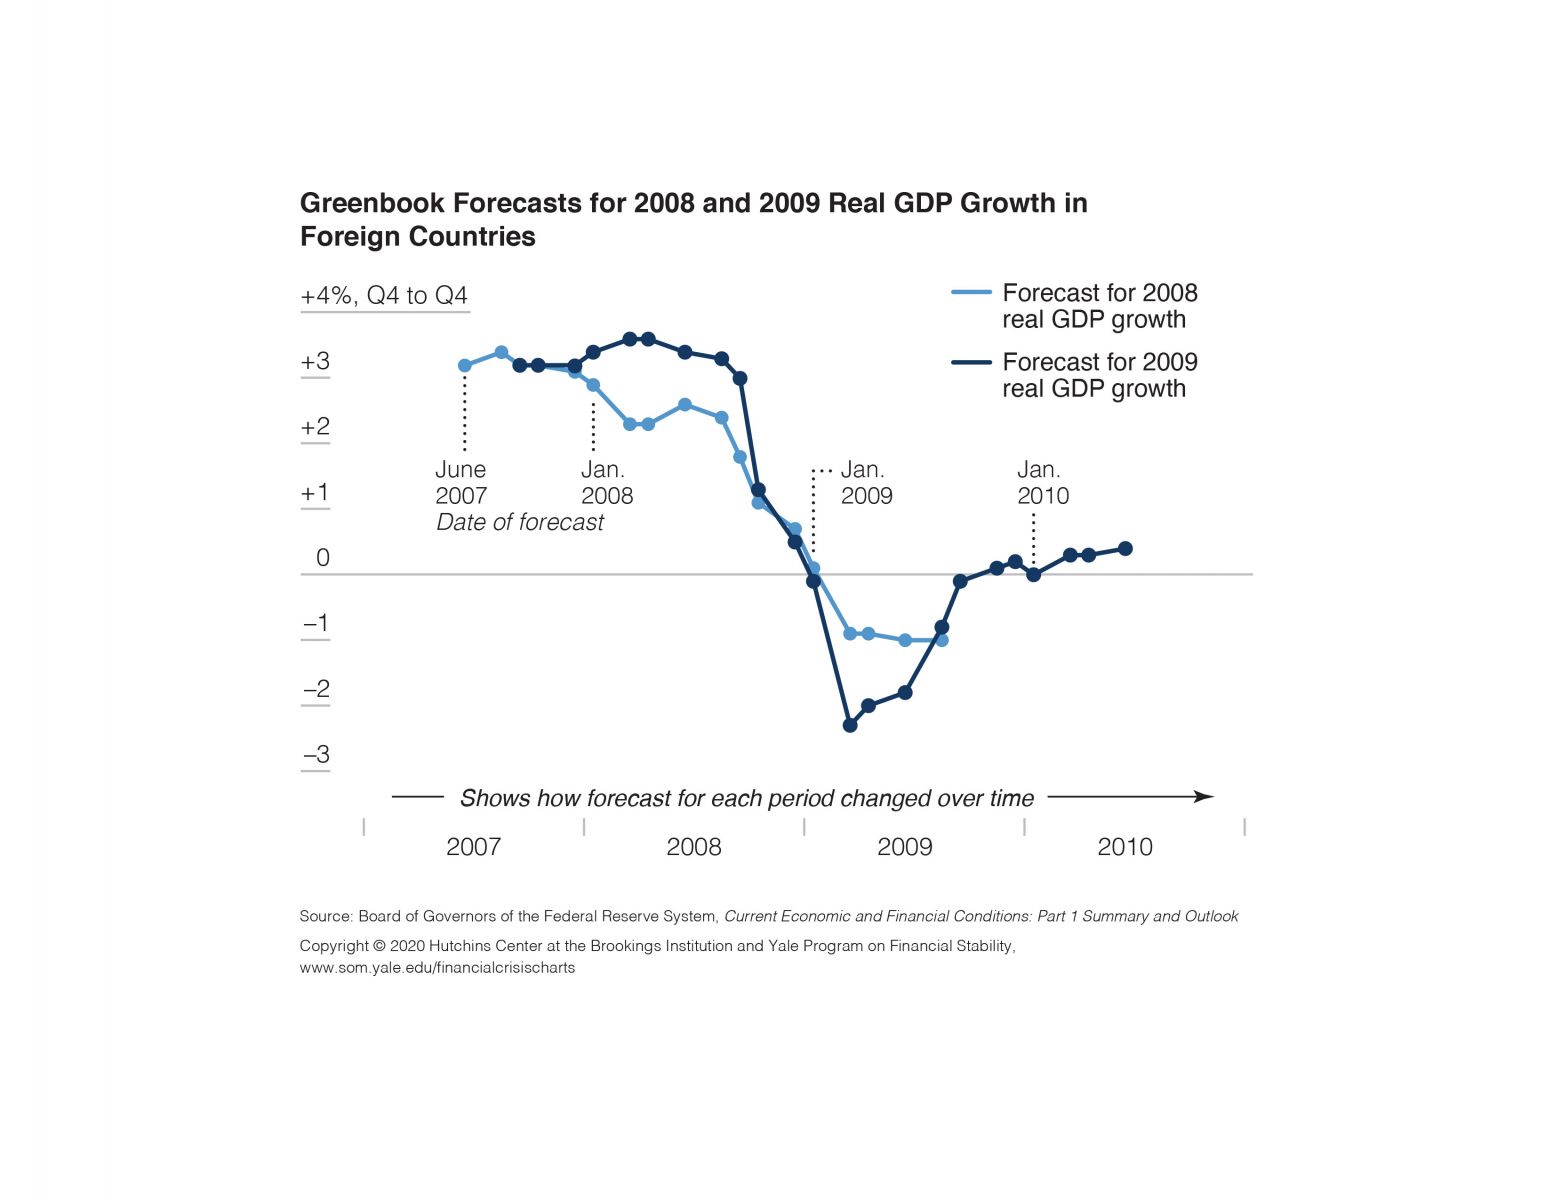
Greenbook Forecasts for 2008 and 2009 Real GDP Growth in Foreign Countries, June 2007–June 2010
Central Bank Liquidity Swaps, 2008–2010, and 2008 Swap Line Limits
Increase in IMF Lending Commitments over a 15-month Period from Starts of Asian and Global Financial Crises
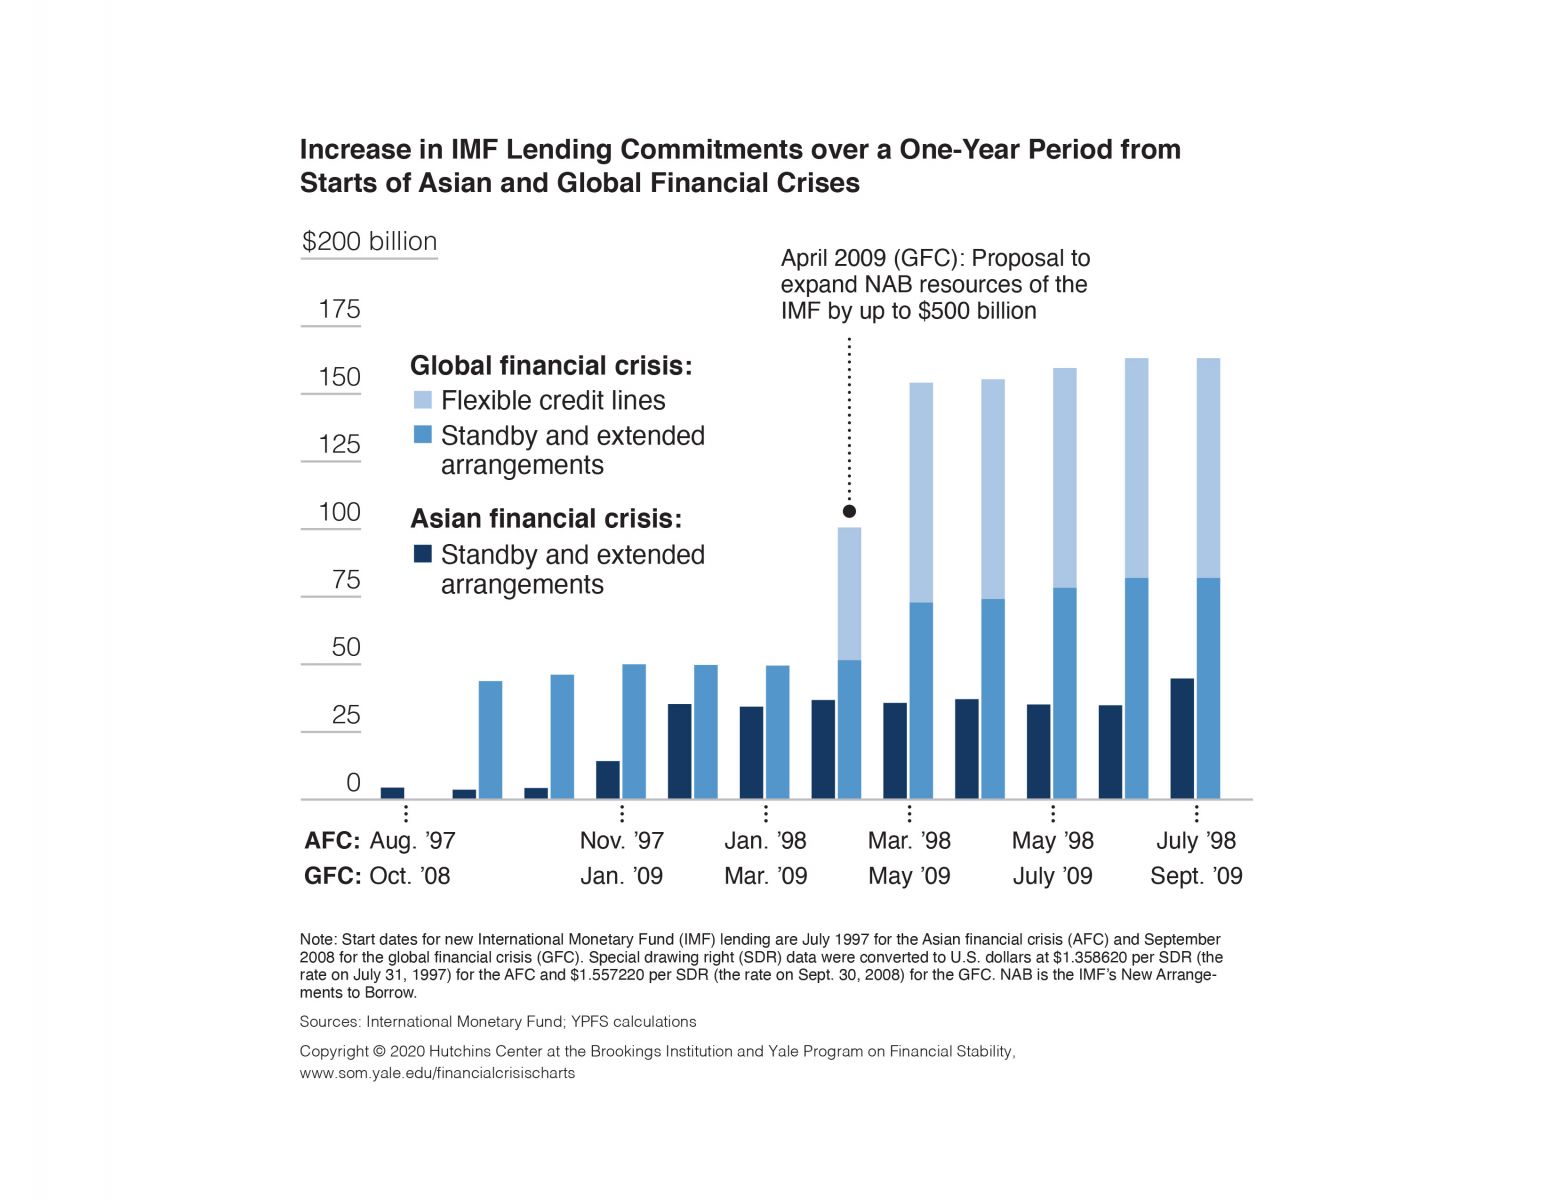
Increase in IMF Lending Commitments over a One-Year Period from Starts of Asian and Global Financial Crises
Outcomes and Conclusions
Outcomes and Conclusions
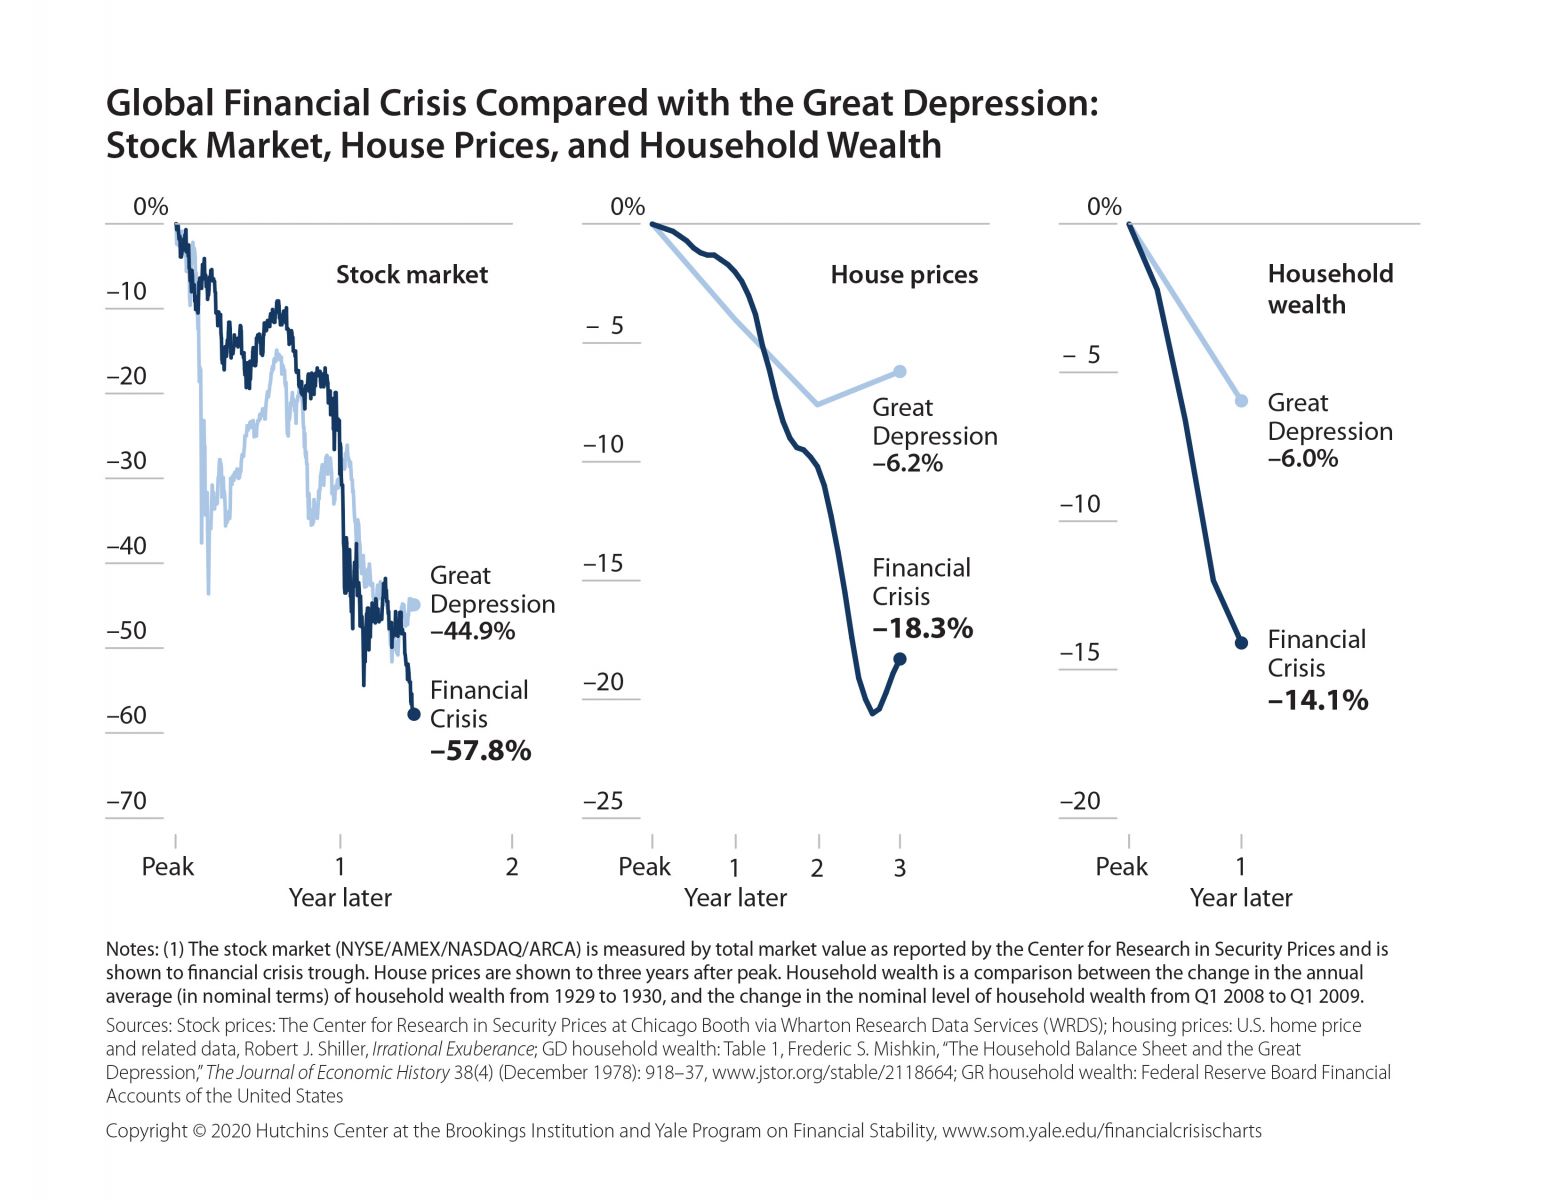
Global Financial Crisis Compared with the Great Depression -- Stock Market, House Prices, and Household Wealth
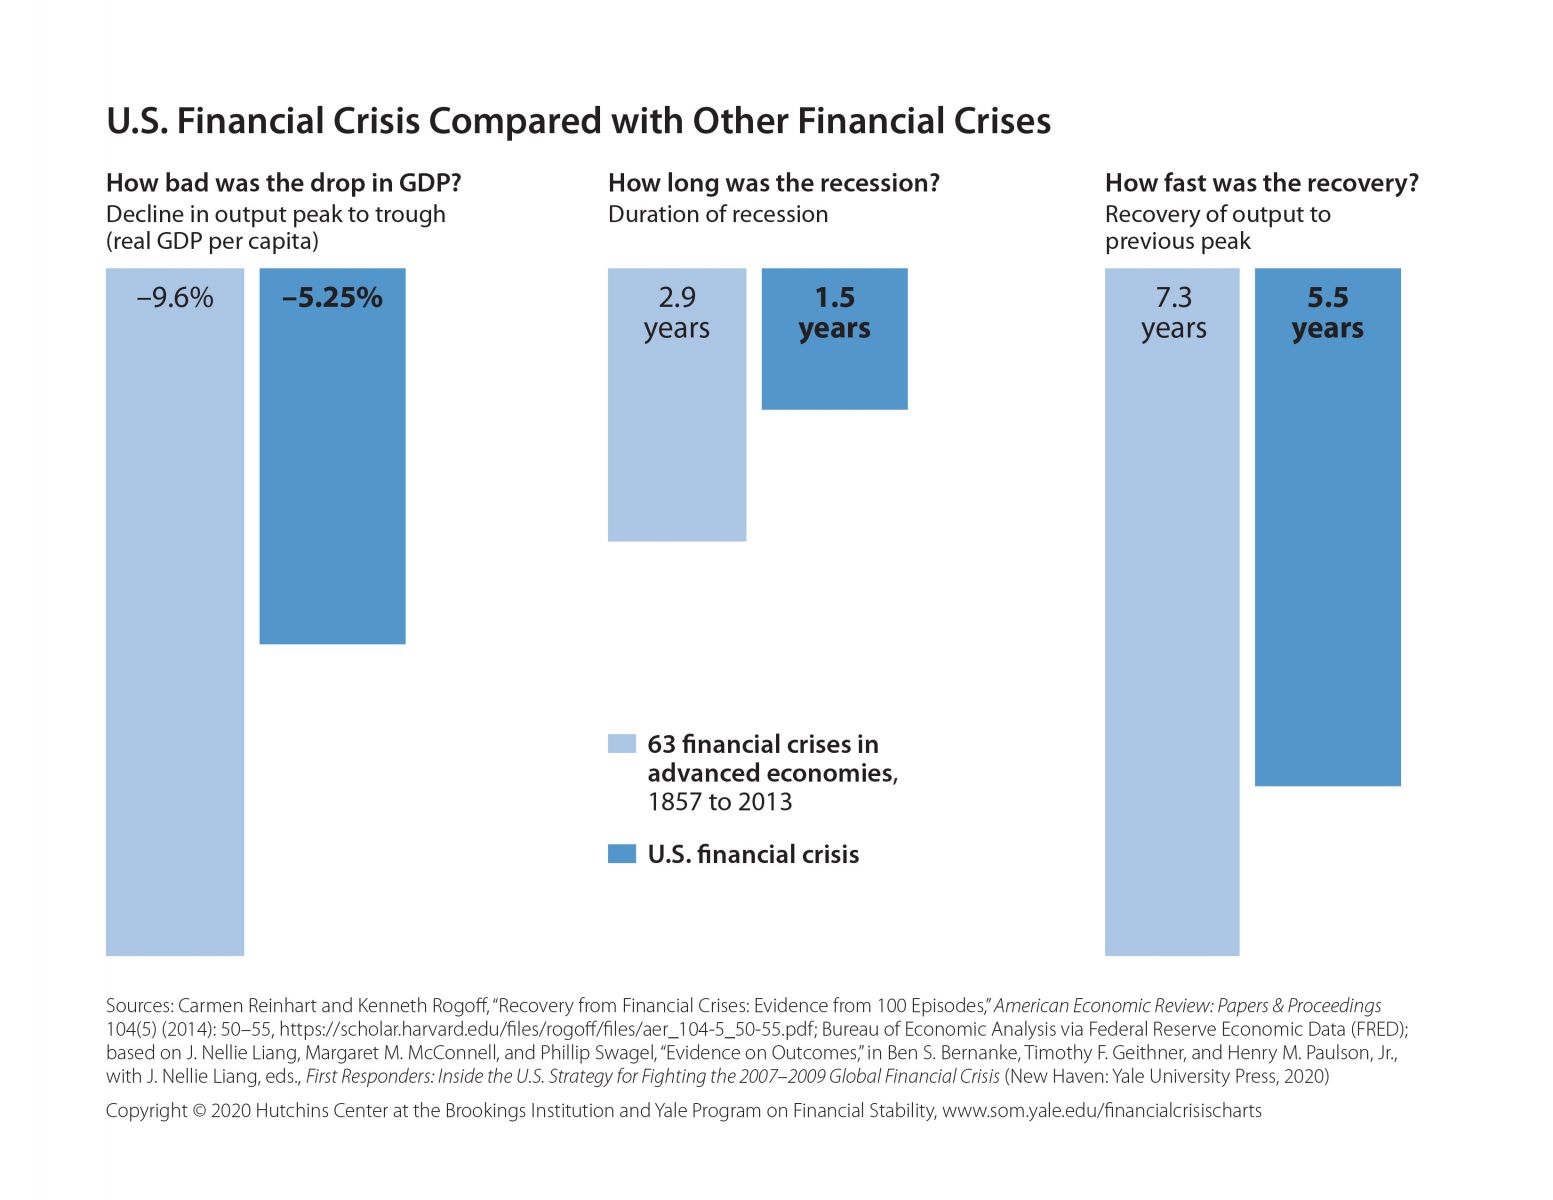
U.S. Financial Crisis Compared to Other Financial Crises, 1857–2013
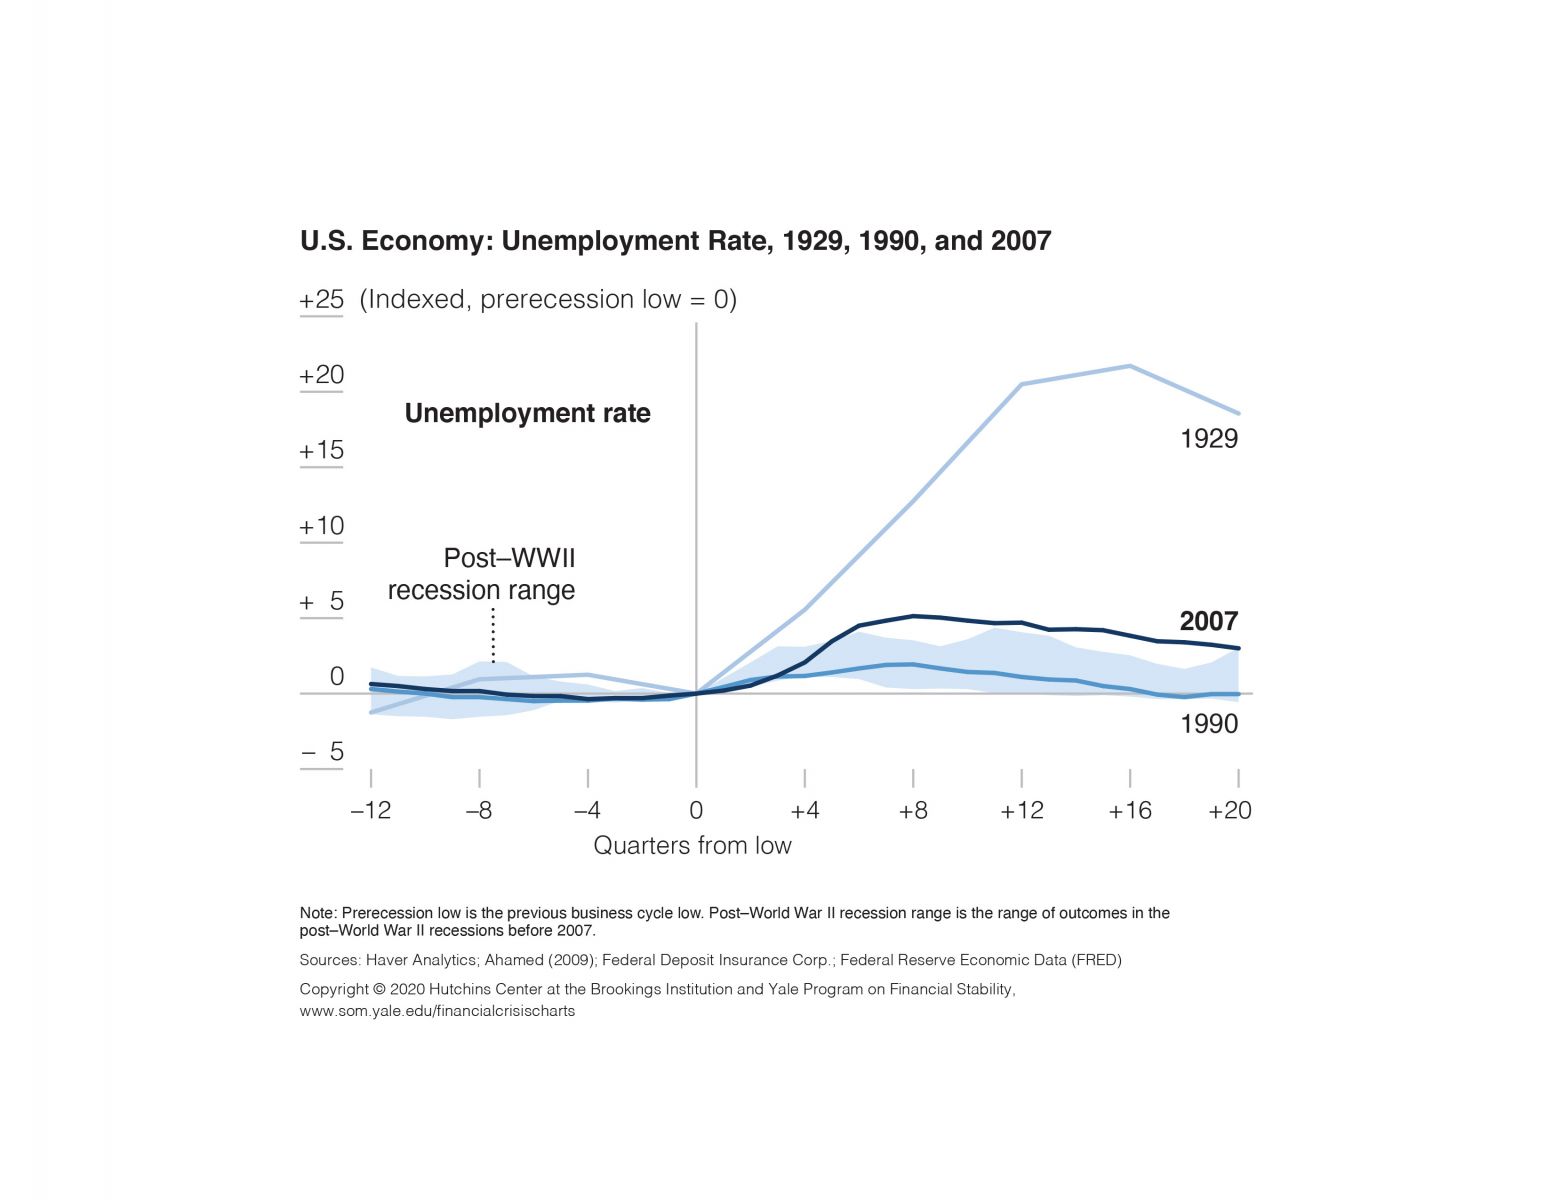
U.S. Economy -- Unemployment Rate in 1929, 1990, and 2007
U.S. Economy -- Bank Credit in 1929, 1990, and 2007
Three-Month Libor-OIS Spread and Selected Events, 2007–2010
CDS Spreads for U.S. Financial Firms and Selected Events, 2007–2010
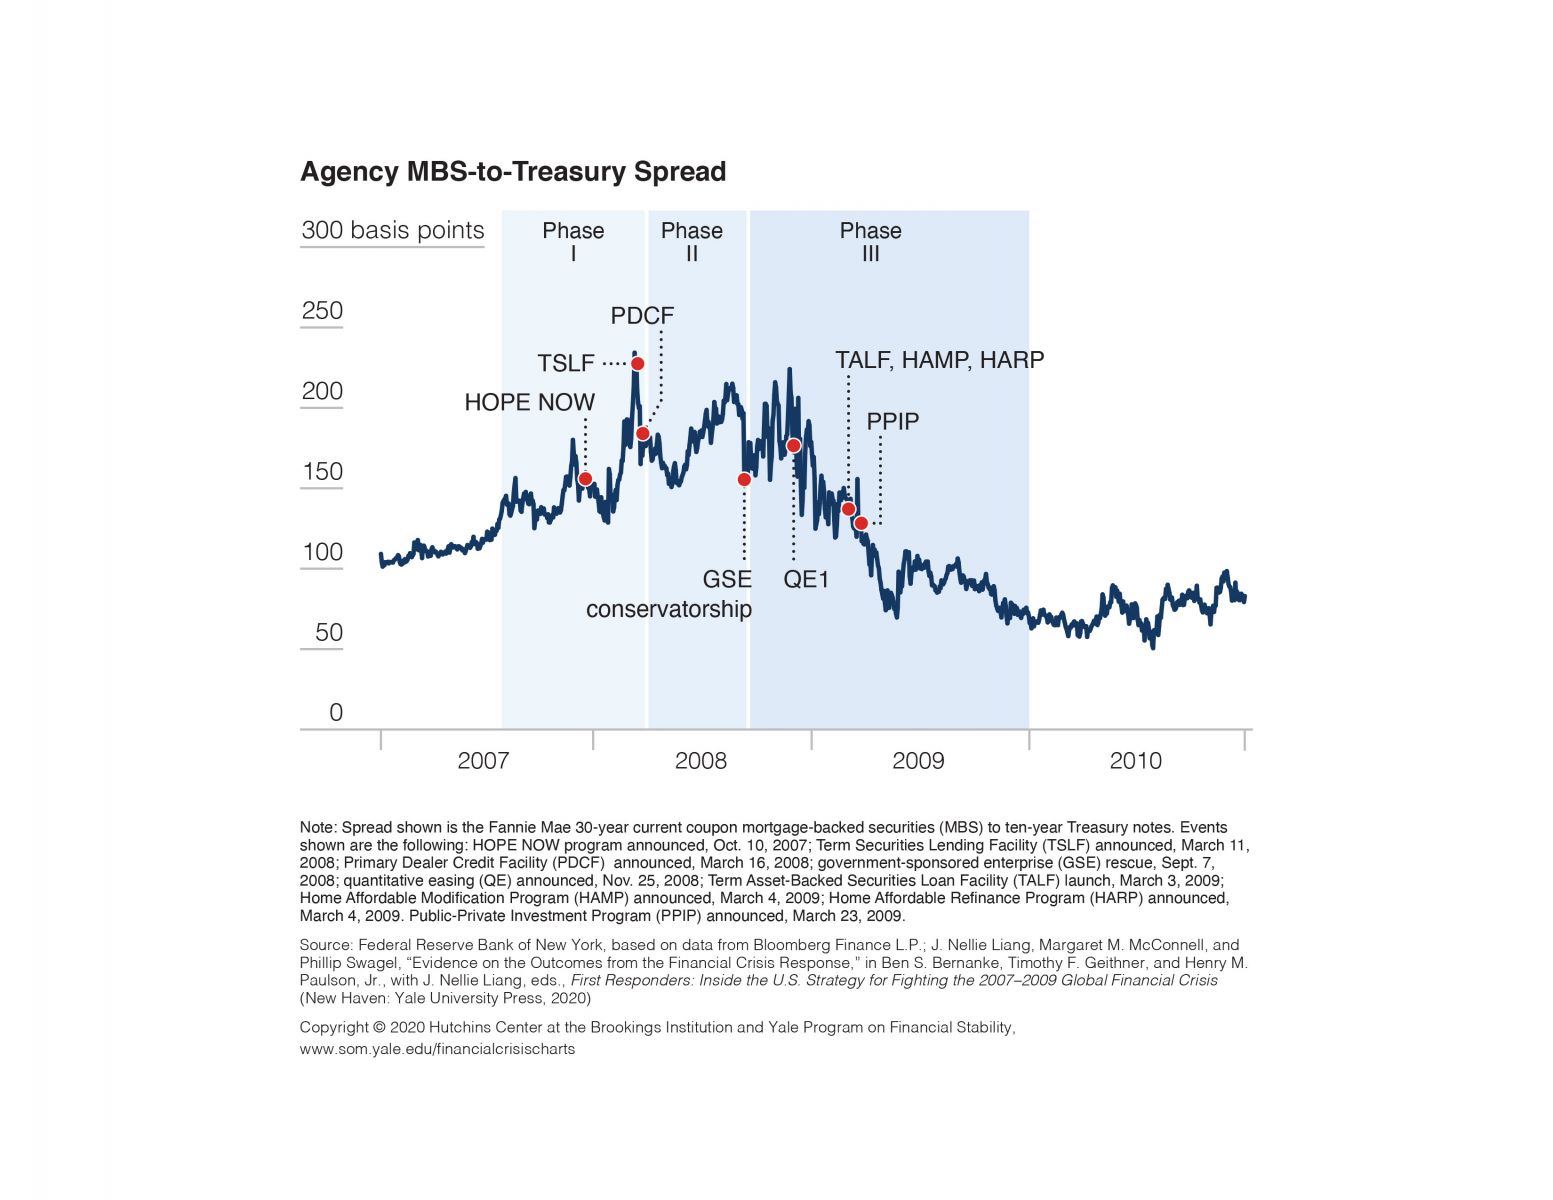
Agency MBS-to-Treasury Spread and Selected Events, 2007–2010
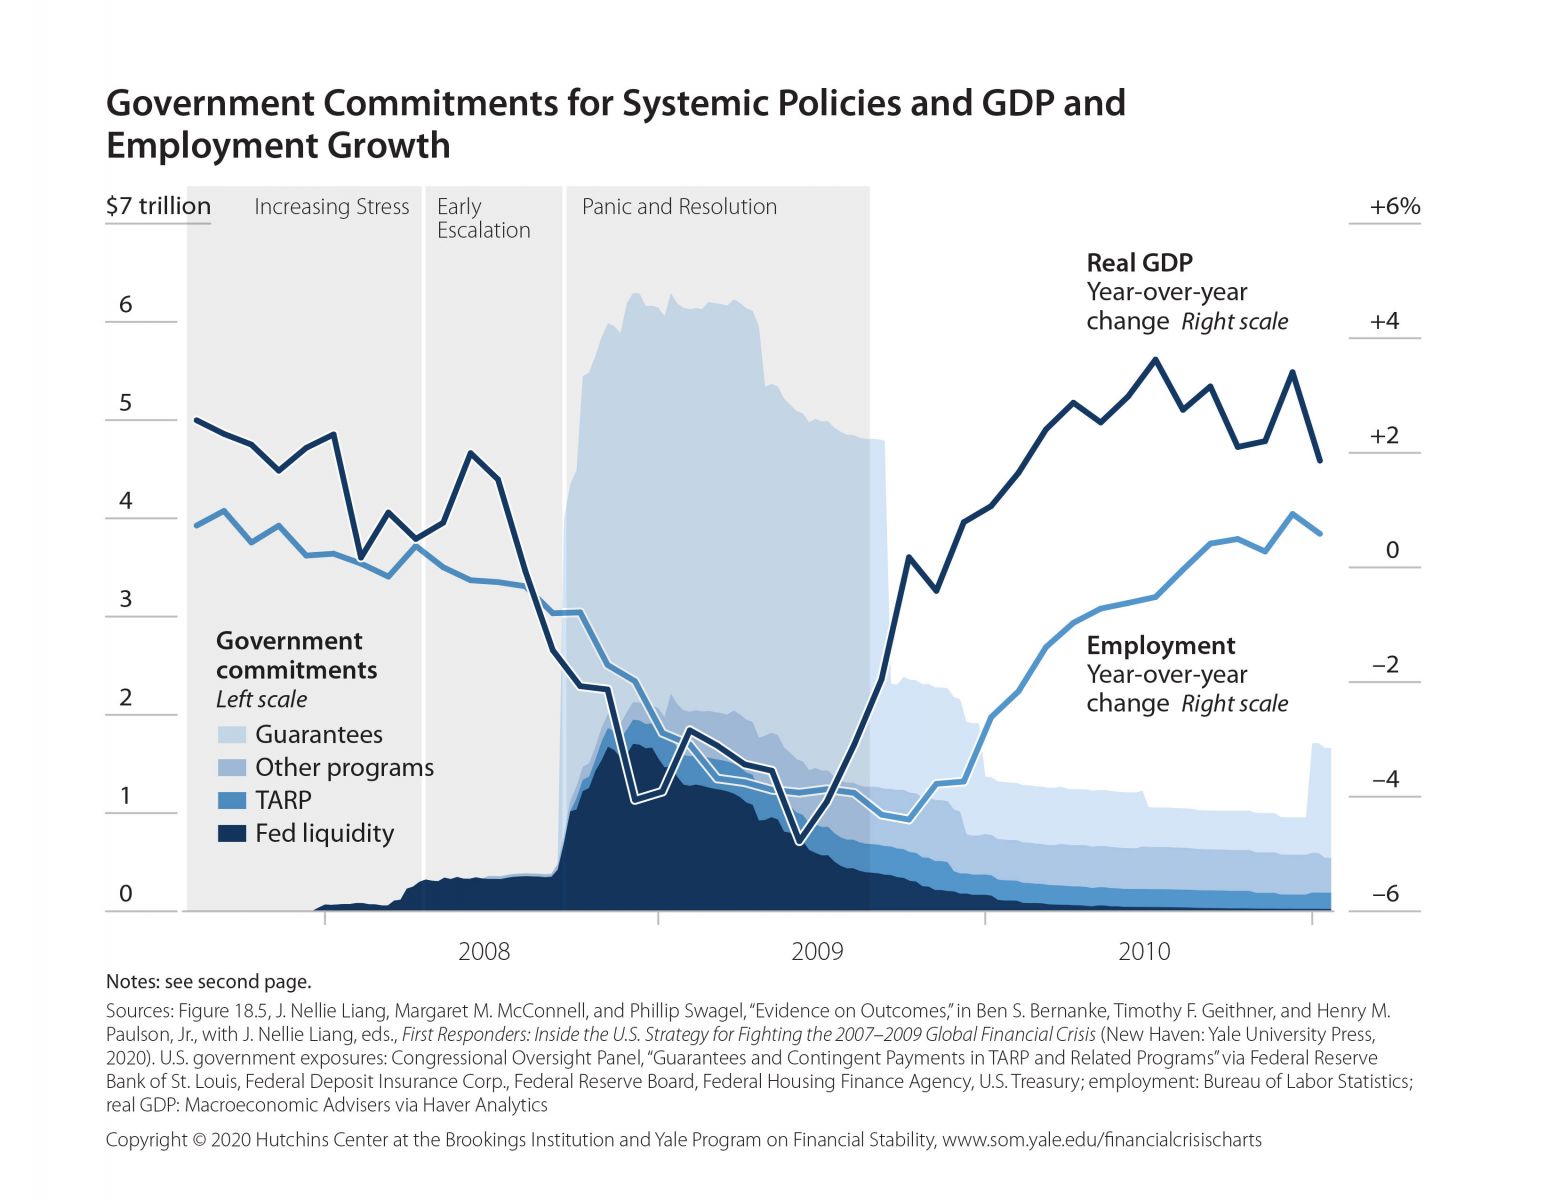
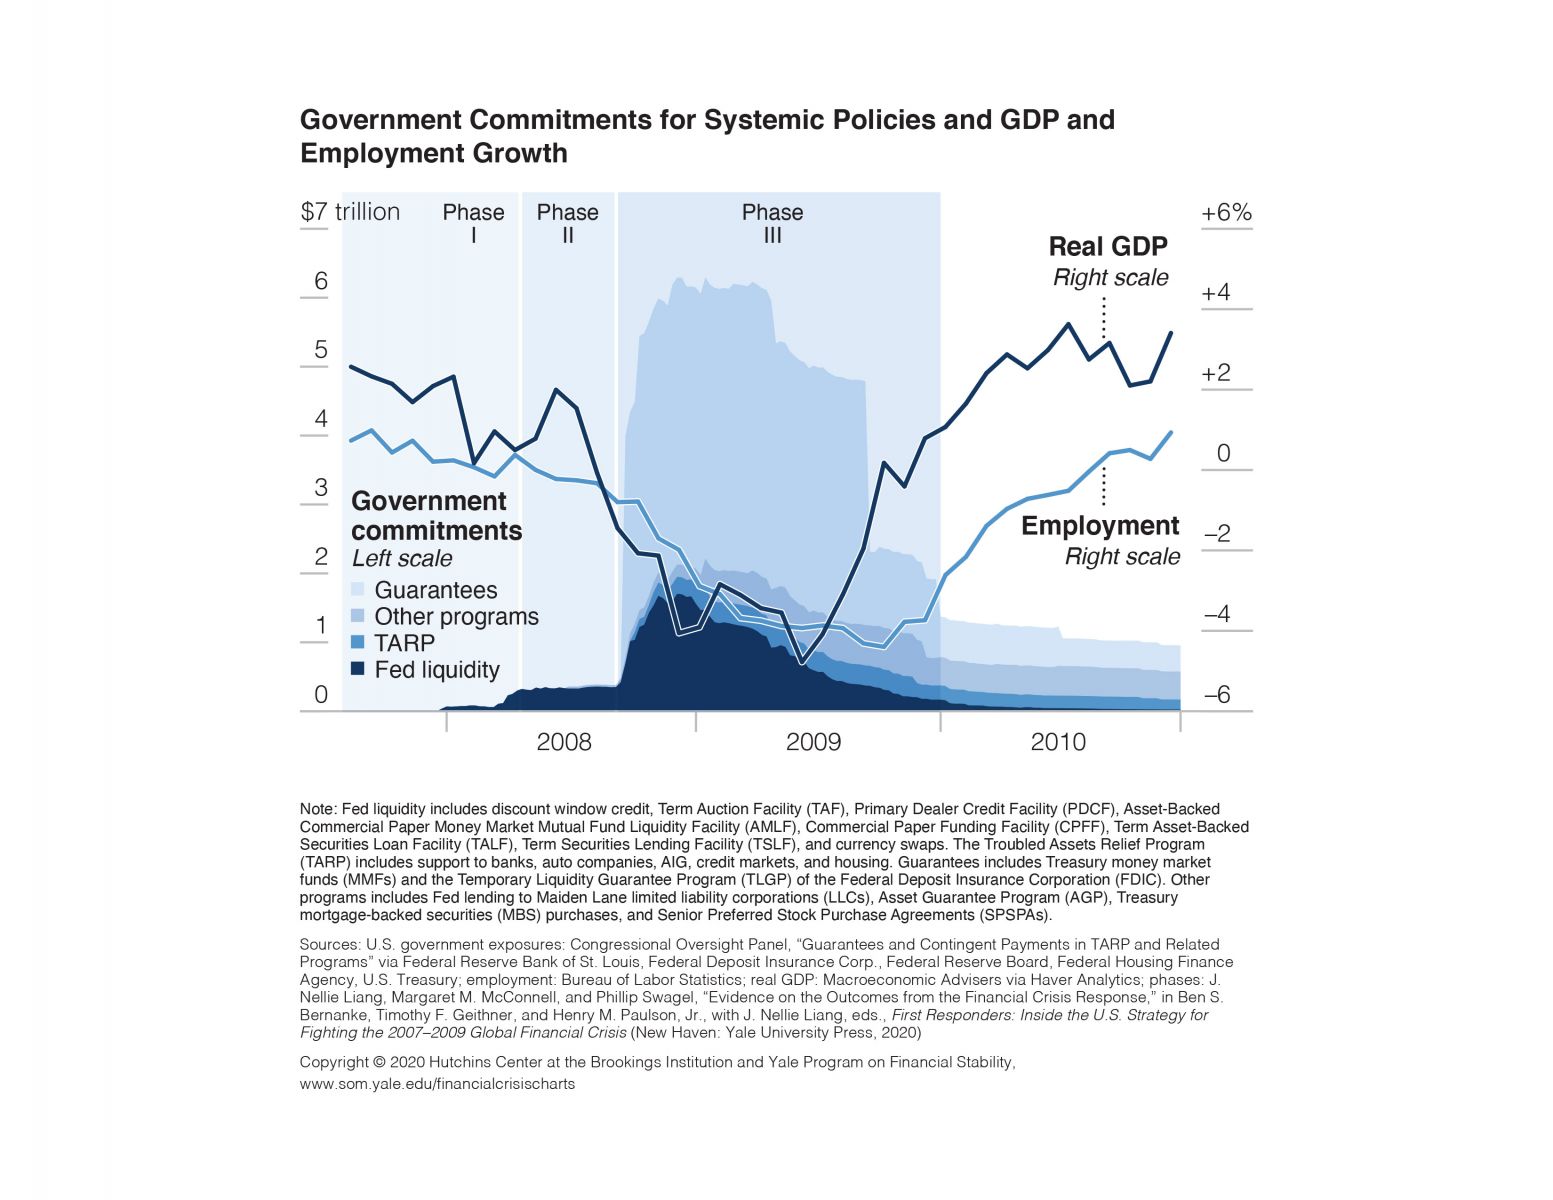
Government Commitments for Systemic Policies and GDP and Employment Growth, 2007–2010
Government Commitments for Systemic Policies and GDP and Employment Growth, 2007–2010
2007–2009 Global Financial Crisis: Real GDP Ten Years Later
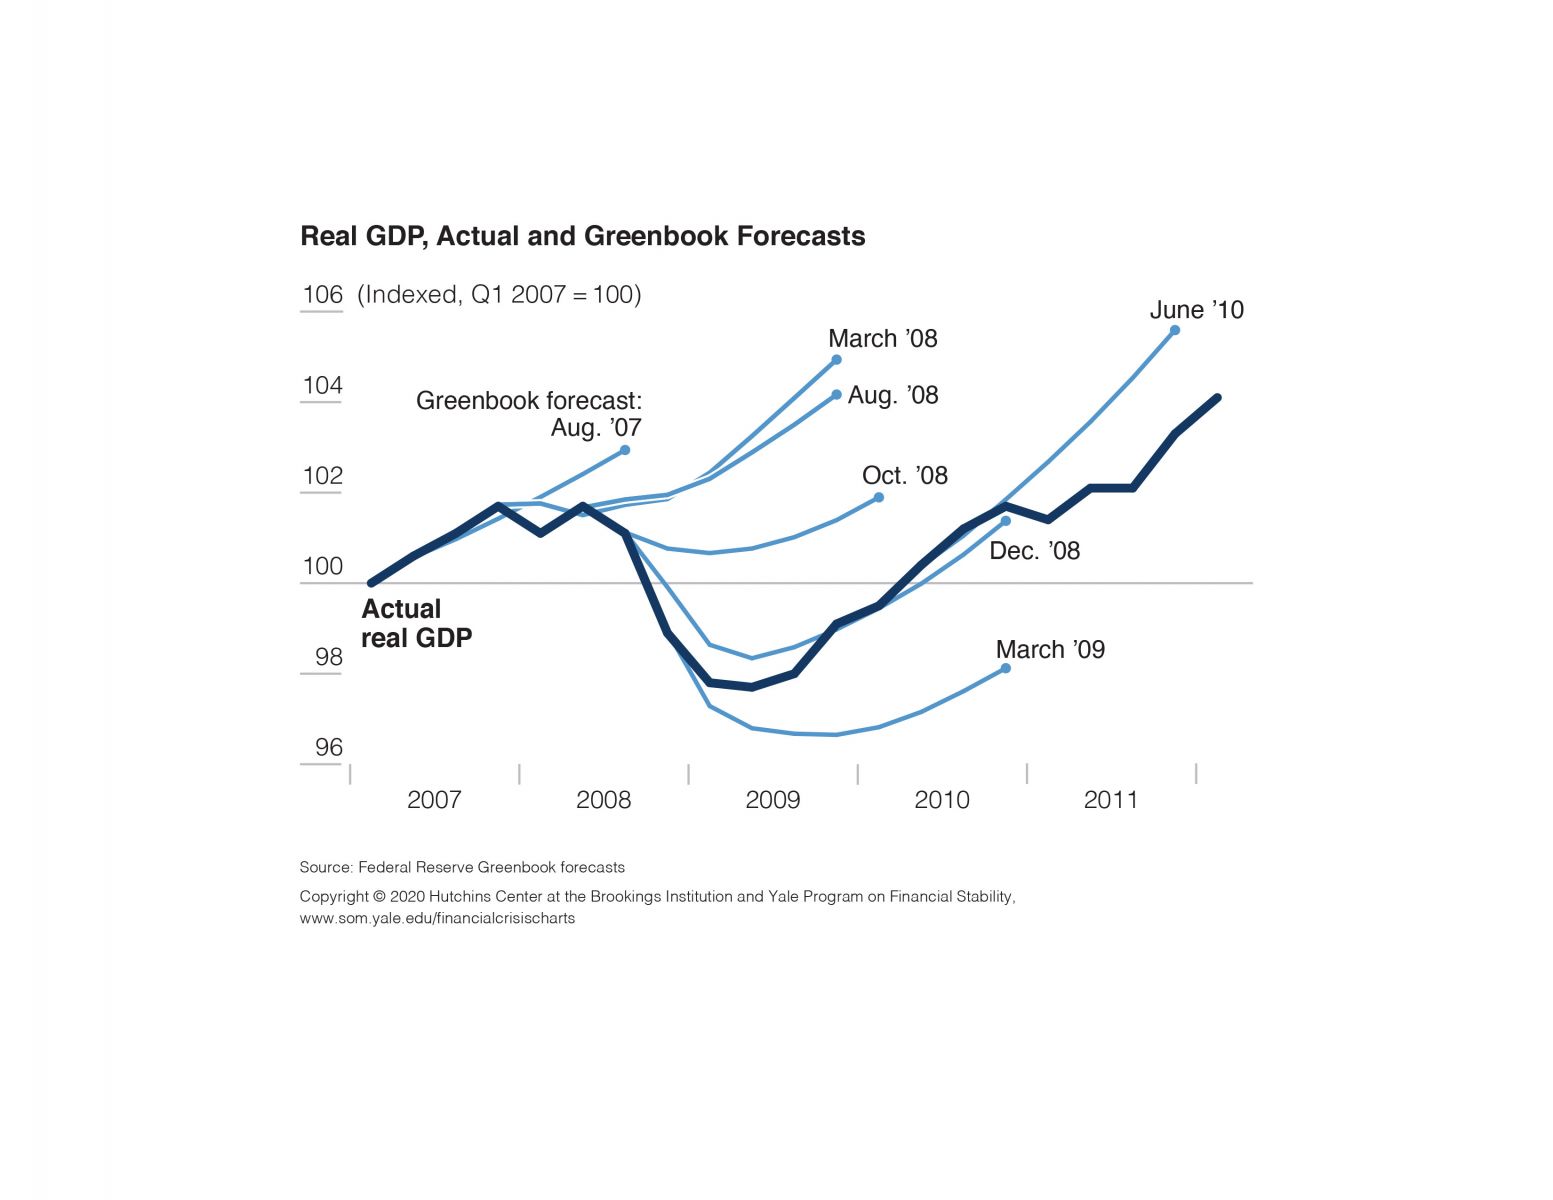
Real GDP, Actual and Greenbook Forecasts, 2007–2011
Change in Real GDP from Peak for Recent Recessions and the Financial Crisis
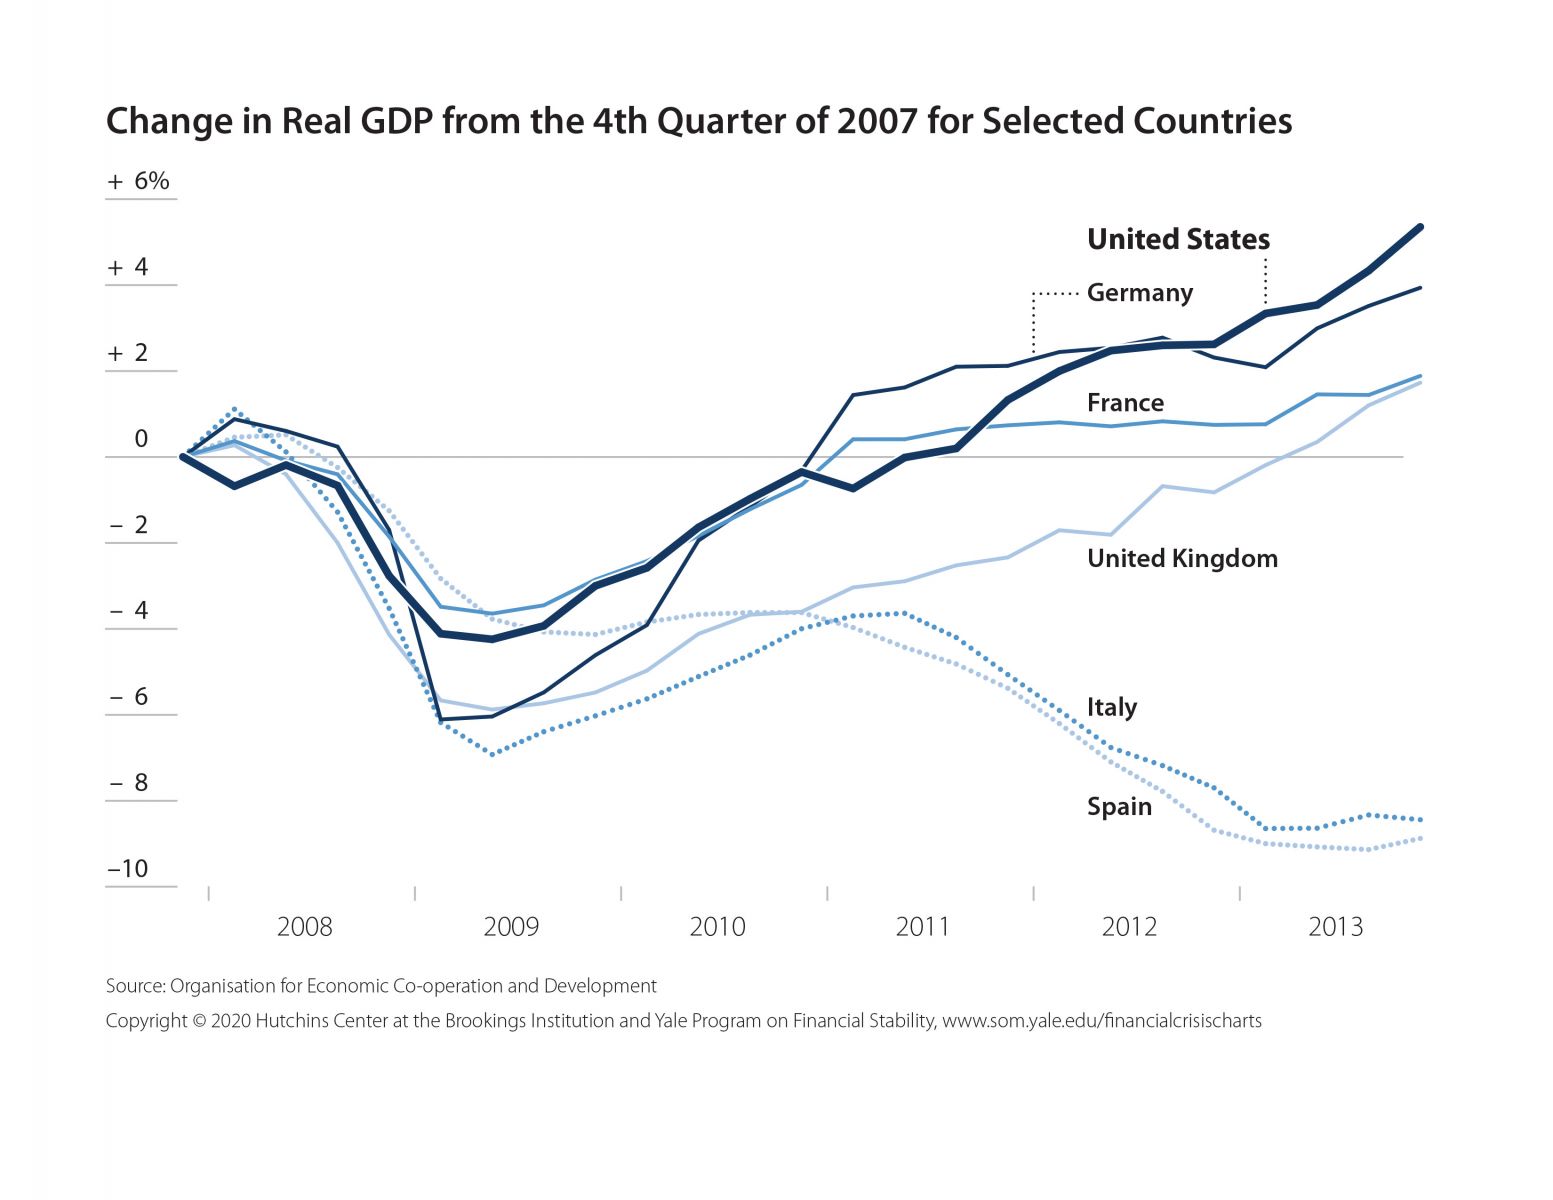
Change in Real GDP from the 4th Quarter of 2007 for Selected Countries, 2007–2013
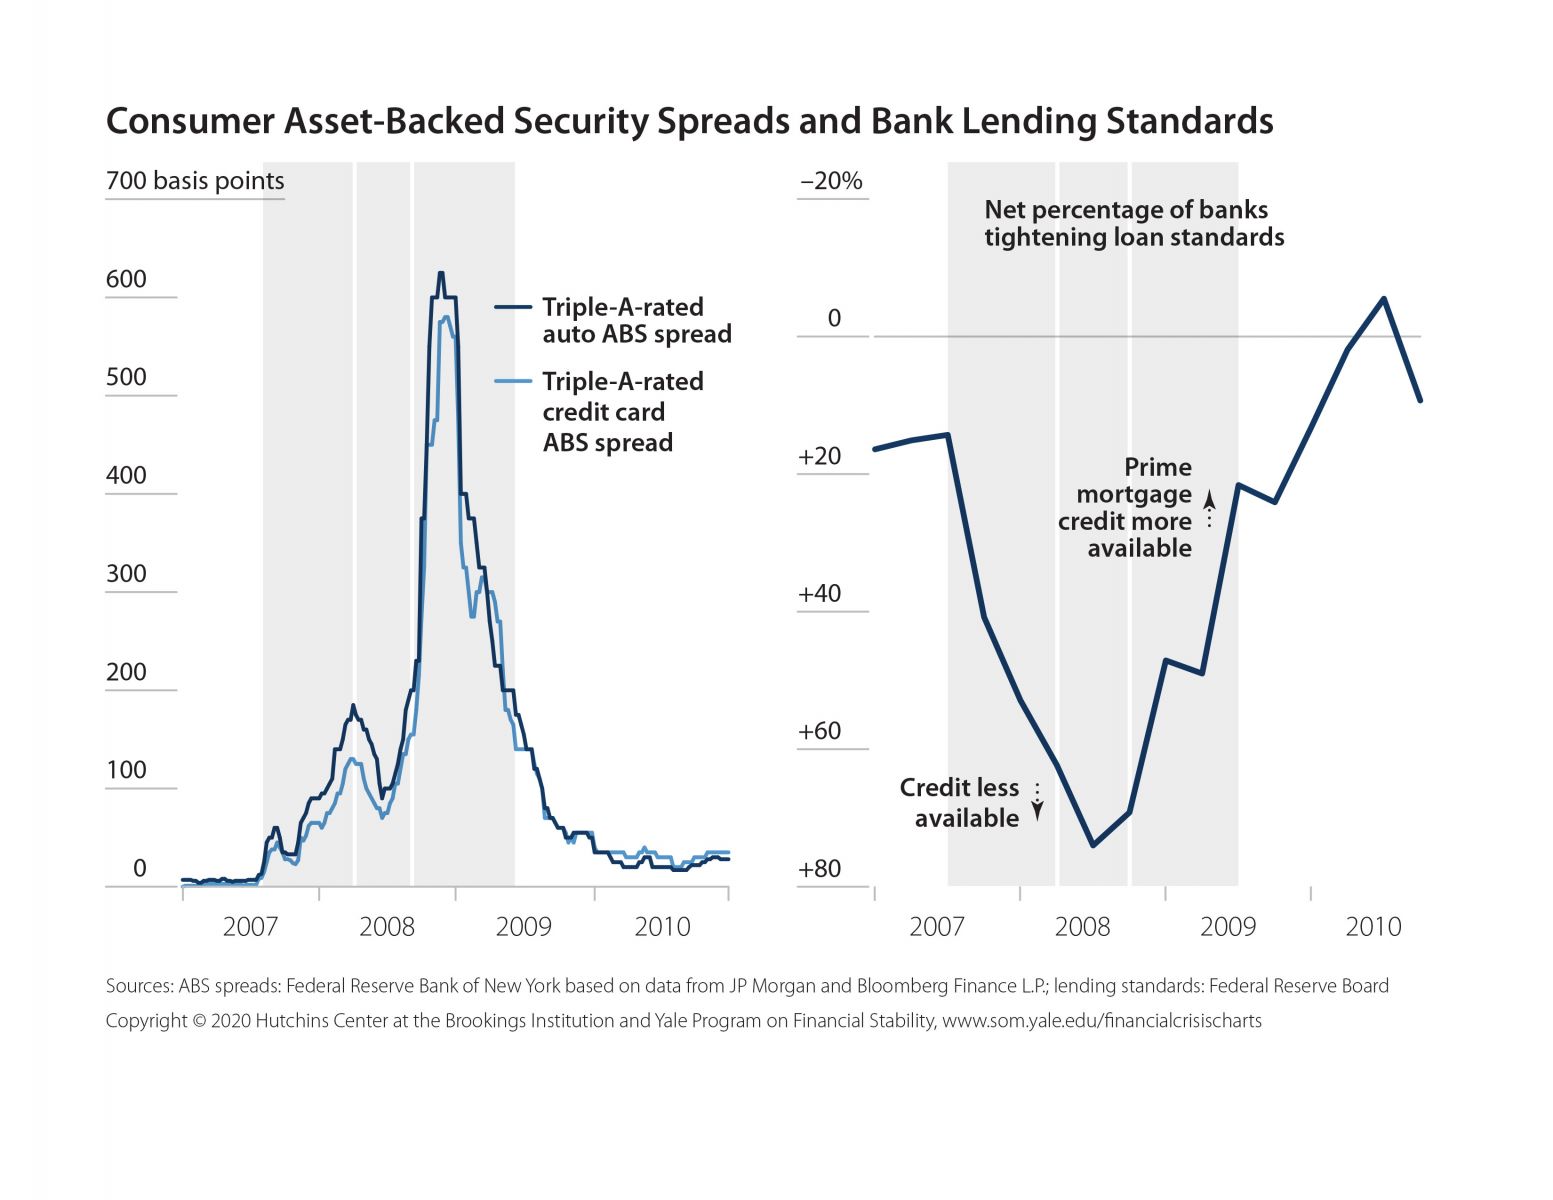
Consumer Asset-Backed Security Spreads and Net Percentage of Banks Tightening Lending Standards, 2007–2010
Income or Cost of Financial Stability Programs
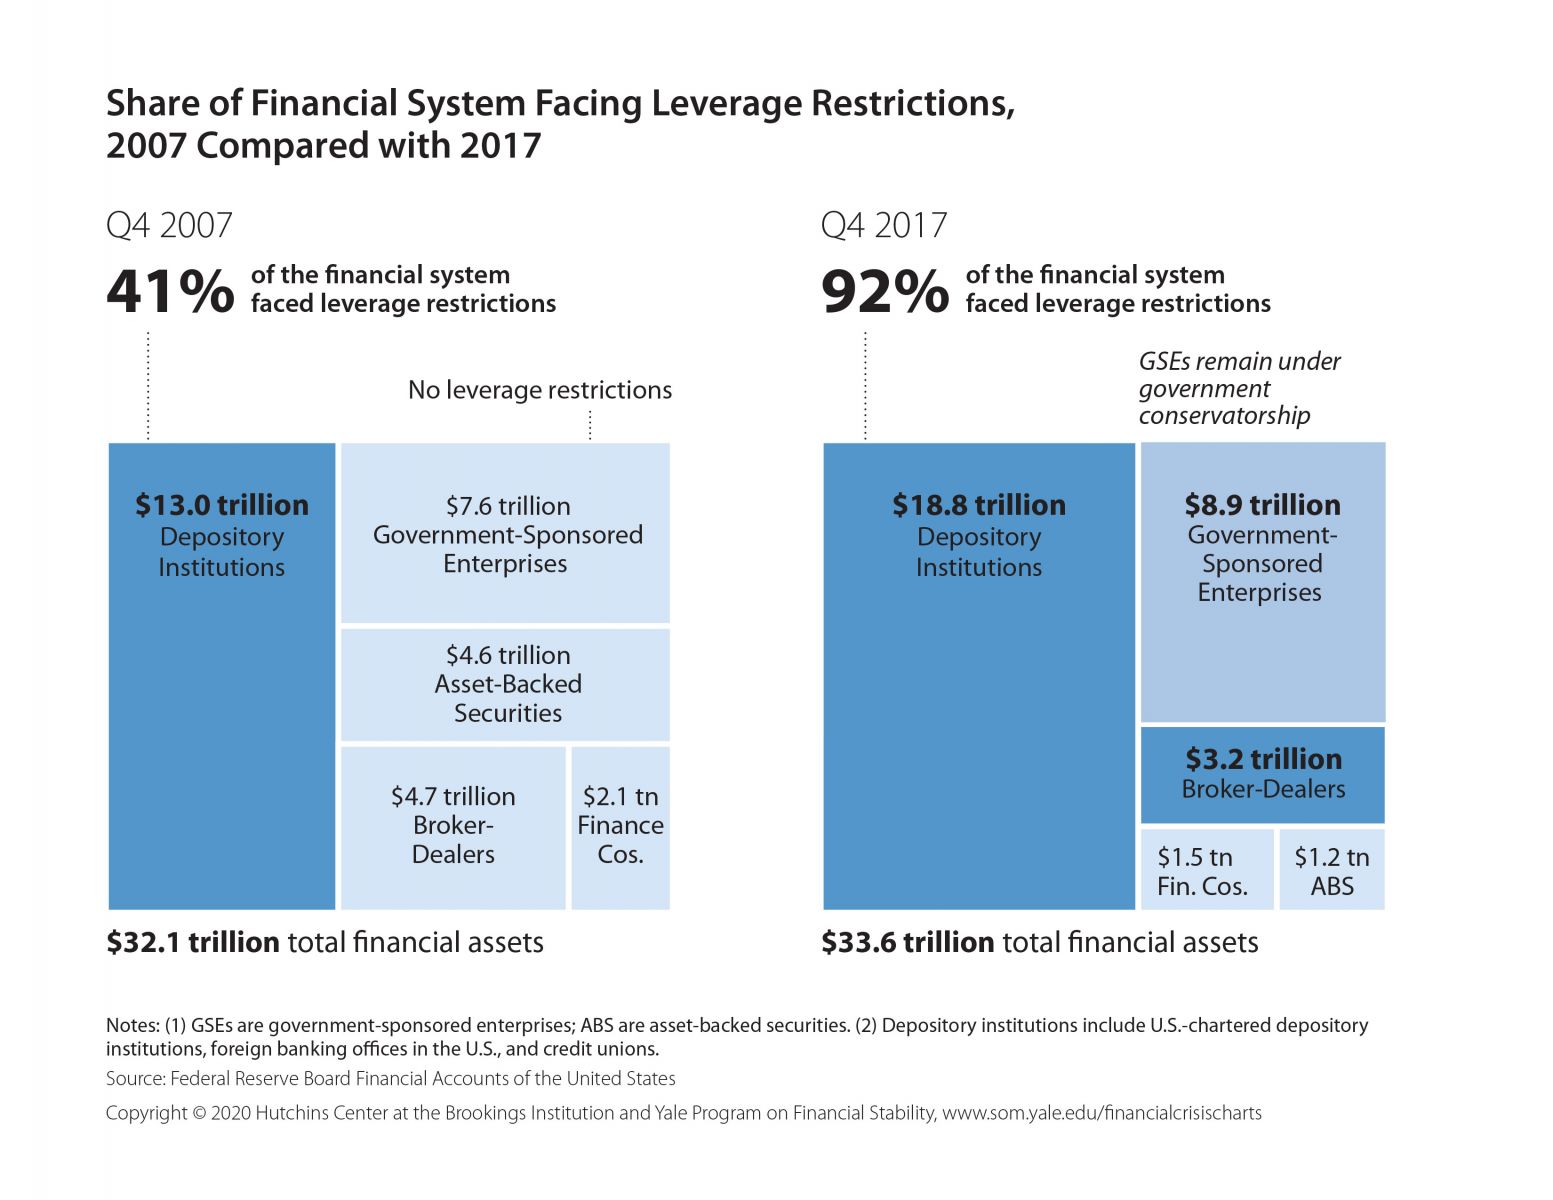
Share of Financial System Facing Leverage Restrictions, Q4 2007 Compared with Q4 2017
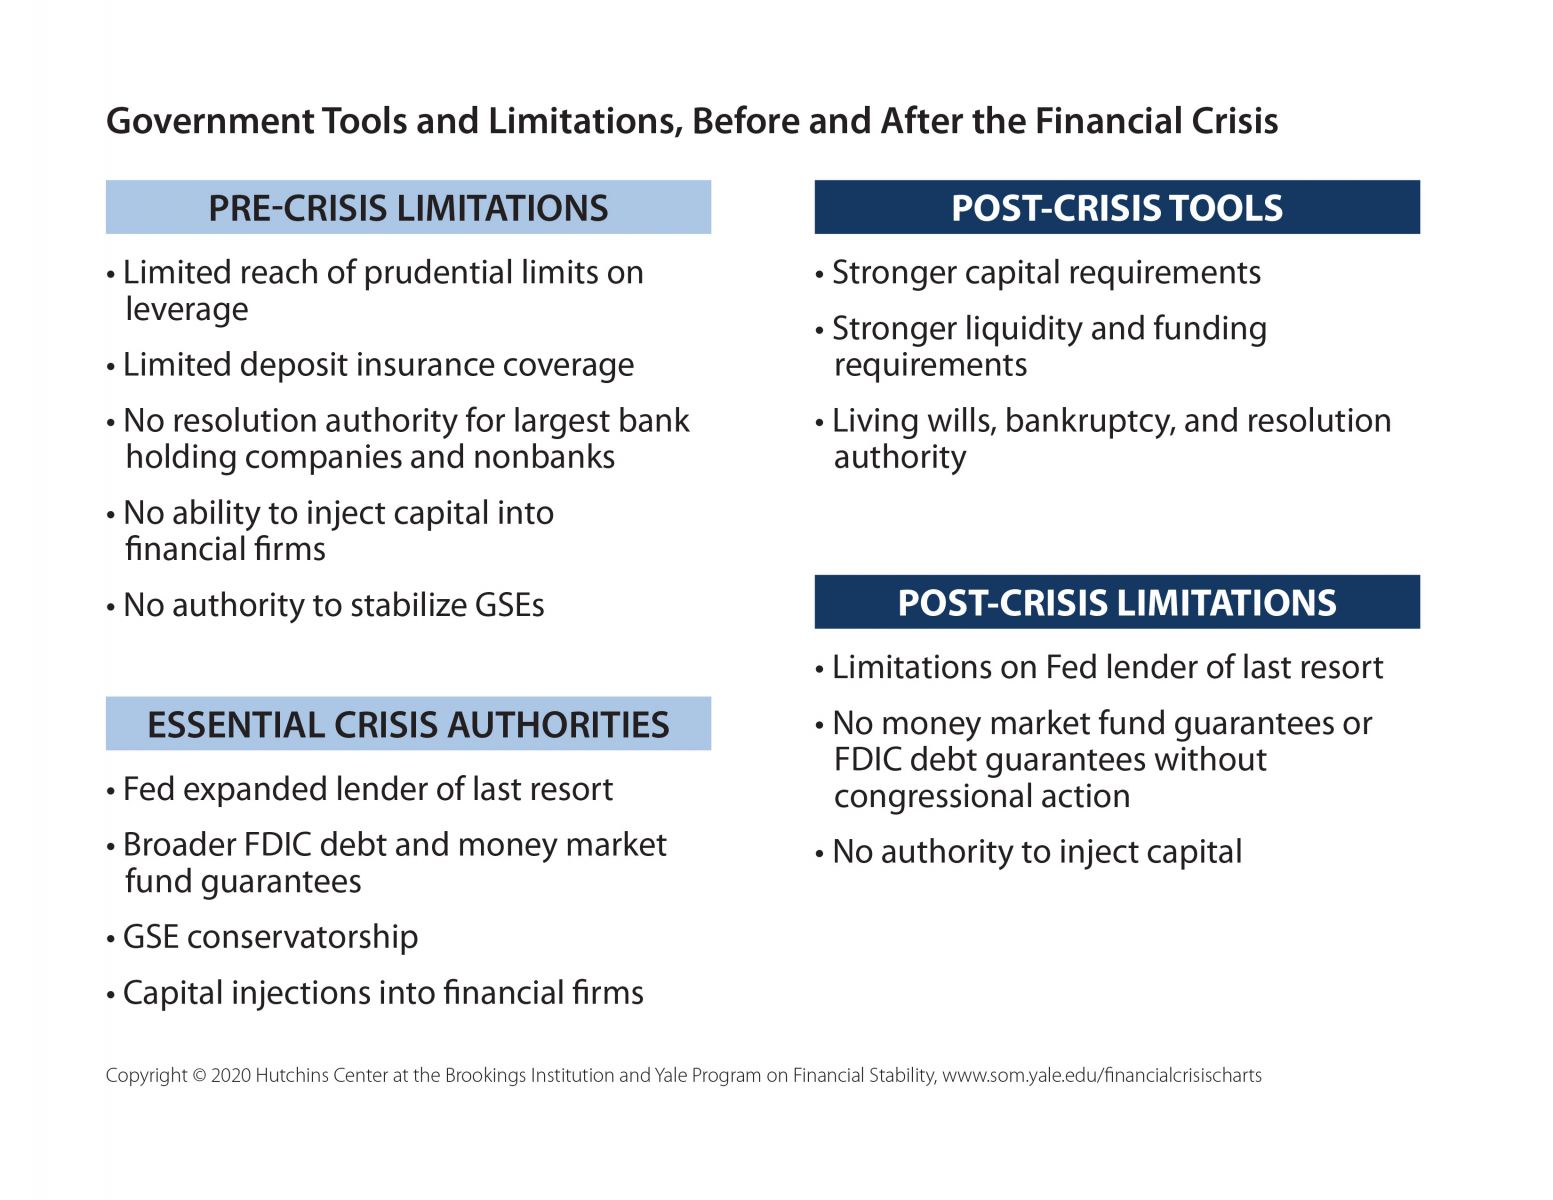
Government Tools and Limitations, Before and After the Financial Crisis
About the Charts
The creation of these charts was sponsored by the Hutchins Center on Fiscal and Monetary Policy at the Brookings Institution and the Yale Program on Financial Stability (YPFS), as part of a project led by former Federal Reserve chairman Ben S. Bernanke and former Treasury secretaries Timothy F. Geithner and Henry M. Paulson, Jr., to explore the U.S. government’s responses to the 2007–2009 global financial crisis. The data were carefully collected and vetted, analyzed, and plotted under the guidance of YPFS researchers—and now comprises one of the largest independent archives of financial crisis data available today.
Attribution and Usage Policies
The charts may be used free of charge, in accordance with the following terms: You may copy and redistribute one or more charts for noncommercial purposes so long as you provide proper attribution (which may be done using our recommended citation) and indicate if any changes were made to the cited content. You may not remix, transform, or build upon any chart, and may not distribute any modified chart. The use of these charts is governed by a Creative Commons Attribution-NonCommercial-NoDerivatives 4.0 International (CC BY-NC-ND 4.0) license.
Recommended Citation
The recommended form for citing the charts is: Hutchins Center at the Brookings Institution and Yale Program on Financial Stability, Visualizing the Financial Crisis, [Chart Title] (2020).