Silicon Valley Bank’s Liquidity, Part Two: What About the Net Stable Funding Ratio?
Our blog last week concluded that Silicon Valley Bank (SVB) would have failed the liquidity coverage ratio (LCR) test, had regulators held the bank to that standard.
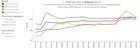
Today we’ll show that SVB actually would have complied with the net stable funding ratio (NSFR), the other international standard introduced in the wake of the Global Financial Crisis of 2007-09 to address banks’ funding and liquidity risks. We estimate the bank’s NSFR would have been 132%, comfortably above the regulatory 100% target and above the global average of about 120% (which excludes US banks; see Figures 1 and 2).
Based on that estimate, SVB’s NSFR would not have raised any alarms about the bank’s extraordinary exposures to uninsured deposits on the liability side of its balance sheet and long-dated agency mortgage-backed securities on the asset side.
However, that result does not mean that SVB actually managed its funding risks appropriately. Nobody could seriously argue that. Rather, the result reflects potential weaknesses in the 2020 NSFR rule itself and in the 2014 Basel standard on which US regulators based the rule. In particular, (1) How stable should the rules consider uninsured wholesale deposits to be, given the runs in this episode and earlier episodes? And, (2) Are the haircuts on held-to-maturity assets sufficient?
Note that this column is not exactly about regulators’ decision in 2019 to exempt banks of SVB’s size from the NSFR. Regulators did exempt the bank, but it would not have mattered if they hadn’t, as the rule only requires the very largest US banks to begin publicly reporting their NSFRs later in 2023.
Still, it’s worth asking what we would have learned about SVB had it been subject to the rule and had the rule required the bank to publicly report its NSFR and disclose more information to its supervisors in the run-up to its failure.
As in the LCR calculations, we have made the most of publicly available information. Interpretations of the rule are largely based on the memo that Federal Reserve Board staff published with the press release in 2020.
Background on the NSFR
The NSFR measures banks’ maturity transformation risk over one year—that is, the extent to which banks fund long-term assets with short-term liabilities. Maturity transformation is the core business of banking, of course, and it creates the most basic risks that banks must manage.
The NSFR rule requires banks’ available stable funding (ASF) to exceed their required stable funding (RSF) over a 12-month timeframe. The NSFR complements the LCR, which requires banks to hold sufficient high-quality liquid assets (HQLA) to manage expected net cash outflows in a 30-day stress scenario. The LCR focuses on the quality and liquidity of assets; the NSFR focuses on the quality and stability of liabilities—that is, funding sources.
The NSFR applies multipliers, called factors, to reflect the relative stability of each funding source in the numerator and the relative long-term nature of each asset that needs funding in the denominator. For example, in the numerator, capital and long-term debt are considered 100% stable and insured retail deposits are considered 95% stable; the more of these liabilities, the better. Uninsured wholesale deposits get a much lower stable funding factor of 0% to 50%, depending on nuances that we discuss below.
In the denominator, loans with more than one year left to mature typically require a lot of stable funding. Their required stable funding factors range from 65% for relatively low-risk, nonfinancial loans to 100% for long-term financial loans.
Most securities, however, are considered short-term holdings and require far less stable funding. The most liquid securities, which regulators consider to be Level 1 HQLAs—central bank reserves, US Treasuries, and other government-backed securities—don’t require any stable funding at all. Level 2A HQLAs require 15% stable funding. These include agency mortgage-backed securities issued by the government-sponsored enterprises, Fannie Mae and Freddie Mac, which dominated SVB’s portfolio.
Numerator: Available Stable Funding
SVB had $17.9 billion in regulatory capital and $5.4 billion in long-term debt at the end of 2022, contributing a total of $23.3 billion in available stable funding based on the 100% funding factor in the rule. Insured retail deposits of $7.7 billion contributed $7.3 billion (95%); uninsured small business and retail deposits of $27.1 billion, based on our estimates, contributed $24.4 billion (90%).
The bank also reported $13 billion in short-term funding from the Federal Home Loan Banks. The rule (p. 105) attributes a 50% available stable funding factor to such debt, resulting in a contribution of $6.5 billion.
The rule appropriately considers uninsured wholesale deposits to be far less stable than insured deposits. And it considers deposits that customers need for their operations (for example, payment settlement) to be more stable than other deposits. Operational deposits from financial or nonfinancial companies receive a 50% funding factor. Non-operational deposits receive a 50% factor if they are from nonfinancial companies and a 0% factor if they are from financial companies.
As with the LCR, one of the challenges in estimating NSFRs with only public information is the allocation of uninsured wholesale deposits between the operational and non-operational categories. Again accepting the company’s definition of “operating” from its January 2023 investor presentation suggests a 47%/53% breakdown between operational and non-operational deposits. These assumptions yield available funding of $32.5 billion from operational deposits and $29.0 billion from non-operational deposits held by nonfinancial companies.
Total available stable funding: $123.0 billion.
Denominator: Required Stable Funding
As noted, the NSFR rules are generous for securities that qualify as HQLAs, because they assume repo funding availability. And the NSFR—like the LCR, in fact—doesn’t distinguish between held-to-maturity securities and securities that a bank holds for sale or trading. Thus, the NSFR rule would have treated SVB’s agency MBS as Level 2A HQLAs with a required stable funding factor of just 15% of their carrying value.
The bank held $85.1 billion in agency MBS. Of that, $2 billion were pledged to the Federal Home Loan Banks for more than one year; the rule considers such encumbered securities to be unavailable, so they require 100% stable funding. The remaining $83.1 billion—of which 97% was held-to-maturity—would have required just $12.5 billion in stable funding.
The bank held an additional $8.1 billion of Level 2B HQLAs, like municipal bonds, also held-to-maturity. They carry a 50% required stable funding factor, so they would have required $4.1 billion in stable funding.
SVB had $62.5 billion in undrawn commitments to provide credit or liquidity to its clients. These carry a 5% funding factor, resulting in $3.1 billion in required stable funding. We also assume $3.0 billion in required stable funding to back SVB’s deposits with other banks and $2.7 billion to back nonmarketable securities.
Loans would have contributed the bulk of SVB’s required stable funding, even though they made up only a third of the bank’s balance sheet. More than half of the bank’s loans were revolving loans ($40.5 billion total) from SVB’s Global Fund Banking business line. We assume these would have had a 100% required funding factor in the rule, assuming clients had the ability to roll them over indefinitely; relaxing that assumption could have reduced required funding by about $20 billion. The bank’s 2022 10-K noted that repayment of much of its loans was dependent upon clients’ receipt of funding from third parties (p. 19). During stressed conditions, it seems fair to say that SVB couldn’t be sure when clients would repay these loans.
There was another $5.5 billion in revolving loans and $18.4 billion in other loans to nonfinancial institutions, mostly carrying an 85% required funding factor. These would have required $4.7 billion and $14.2 billion in stable funding, respectively. A small amount of non-revolving financial loans would have required $0.4 billion. Residential mortgages ($9.1 billion) would have required $5.9 billion, based on a 65% risk factor.
Total required funding for loans: $65.8 billion.
Total required stable funding: $93.1 billion.
The resulting NSFR is 132%: 123.0/93.1.
Conclusion
Again, these estimates are based on public information and on the assumptions described here. The company may have reported different figures if supervisors had required it to report its NSFR. And the goal of the analysis isn’t to let the bank’s risk managers and supervisors off the hook for the bank’s bad decisions. Nevertheless, it is surprising that a bank taking extraordinary maturity transformation risks could have passed a test designed specifically to identify such outliers.
A few reasonable tweaks in the rules would have created more cautionary outcomes.
Most important is the treatment of uninsured wholesale deposits. The rapid growth of SVB’s uninsured deposits was one of the biggest red flags the company’s finances should have raised with risk managers and supervisors. Perhaps the rule could be revised to penalize newer uninsured wholesale deposits—give them a lower or even 0% available stable funding factor for the first year, for example. That would help address the risks in all fast-growing banks, not just in SVB.
On the other hand, there were clearly idiosyncratic aspects of SVB’s deposit base. The rule allows firms and their supervisors to adjust assumptions about funding factors in such cases, although it isn’t public knowledge how often they do this. SVB’s uninsured deposits were almost entirely from VC-funded companies. Many of these companies run negative cash flows every month and sustain their businesses through periodic injections of new capital. For that reason, considering those deposits to be 50% “available” over a 12-month horizon may seem extremely optimistic—and note that the rule considers such nonfinancial companies’ deposits to be 50% available whether or not they are operational. Assuming 25% instead would have lowered SVB’s NSFR in our model below 100%, all other assumptions remaining the same; assuming 0% would have lowered its NSFR to 66%.
The other issue that SVB’s failure raises is the treatment of underwater held-to-maturity securities that qualify as HQLAs. The rule requires minimal available stable funding for such securities because it assumes an active repurchase agreement (repo) funding market. In other words, it assumes the repo market will fund 100% of HQLA Level 1 assets and 85% of HQLA Level 2A assets; it requires stable funding for the remainder—0% for Level 1 and 15% for Level 2A.
But if these securities have unrealized losses, the repo market (or other funding sources) won’t fund their full carrying value. One tweak to the rule would require 100% stable funding for the difference between fair market value and carrying value for these securities. So even Treasuries and high-quality agency mortgage-backed securities would require some stable funding in current market conditions, which led to unrealized losses. The rule could continue to require some stable funding based on collateral quality for the remaining fair value, to reflect the risk that funding may become expensive for such securities through higher haircuts.
Boosting the required stable funding in our model for Treasuries (Level 1) from 0% to, say, 15%—including both a 100% charge on a 10% loss and a small new 5% charge for the remaining fair value—and boosting the required stable funding for agency mortgage-backed securities (Level 2A) from 15% to 50%—including a 100% charge on a 20% loss and a higher 30% charge for the remaining fair value—would have lowered SVB’s NSFR to 100%.
Of course, supervisors and regulators could more directly address the risks that companies like SVB take on high quality but held-to-maturity securities by updating their approach to interest-rate risk management. And they could require banks to include unrealized losses in regulatory capital. But those are topics for a different day.
Thank you to Carey Mott for research assistance. The author also appreciates comments from Sigga Benediktsdottir, Adam Trost, and anonymous readers.