Non-primary Home Buyers, Shadow Banking, and the U.S. Housing Market
Introduction
The residential housing bubble has been identified as one of the main culprits of the global financial crisis (GFC), partially fueled by securitization, bank risk taking behavior, and lax financial regulation. More than a decade later, there are still unanswered questions about the mechanisms that drove the housing market misalignment and key lessons learned.
Various theoretical arguments suggest that fundamental factors such as credit supply, interest rates, income and population growth cannot fully explain the house price process. One compelling hypothesis is that the residential housing market resembled an asset bubble in the run-up to the GFC, primarily driven by subprime lending (Mian and Sufi, 2009; 2010). When interest rates jumped, a large share of subprime borrowers defaulted and their homes were subsequently foreclosed upon, triggering the house price bust.
In contrast, others have argued that differences among investor types have significantly contributed to house price dynamics, primarily due to heterogenous preferences and expectations. For instance, housing speculation (such as short-term investments) can be a source of shock amplification, which in turn can lead to systemic risk. One mechanism through which speculation works as a shock amplifier is fire sales. If speculators are highly leveraged, owning multiple properties and being dependent on rental income, any exogenous shock can trigger a rapid deleveraging and potentially drive fire sales of their properties. This mechanism can also have important economic consequences (Gao et al., 2020). Other investors perceive housing as a financial asset, with their expectations mainly anchored in the future price appreciations while rental income acts as a dividend. This phenomenon has led to the rapid growth of REITs (Real Estate Investment Trusts) and the synchronization of house price cycles across the globe. Global cities such as London, New York, and Hong Kong have experienced substantial international capital inflows into their real estate markets. These capital flows are typically driven by global financial conditions. Conversely, when risks increase in emerging markets, international capital flows are searching for safer assets in advanced economies, with housing in global cities representing one asset class.
Conceptually, one of the main drivers of housing markets is the credit supply. Prior to the GFC, shadow banks were heavily involved in mortgage intermediation, heavily relying on the “originate and distribute” model. However, during the GFC, the appetite for private securitization plummeted and shadow banks experienced a sudden stop on the funding side. In the aftermath of the crisis, regulatory changes in the banking industry and the use of new technologies to screen borrowers have significantly contributed to the rebound of shadow banking activity, particularly in the mortgage market.
The relationship of non-Primary Home buyers to house price cycles and rents
In a recent paper, we document the evolution of different types of housing investment demand, using a proprietary and comprehensive dataset covering nearly 90 million US residential transactions over 1998-2018. In the run-up to the GFC, second-home purchases represented a significant share of total transactions, exceeding 15 percent of total transactions in some areas. When the transaction volume collapsed, the fraction of short-term investors (i.e., within-year resales) surged, helping to improve market liquidity. Interestingly, corporate purchases in cash jumped as well after 2008, more than tripling the pre-crisis levels. Overall, non-primary home buyers were involved in more than 30 percent of transactions during 2008-12 period, suggesting their relevance in the residential real estate market (Figure 1).
Figure 1. Non-primary Home Buyers and Transaction Volume

Note: Each type of non-traditional investments is depicted as a share of total transactions, weighted by the sales price. Total transactions include both primary and non-primary home buyers. Total transaction volume (in logs) is plotted on the RHS axis.
More importantly, non-primary home buyers have had an important contribution to the house price cycle over the past two decades. Relying on an instrumental variable analysis, we identify causal effects of non-primary home demand on the housing market. Starting in 2009-10, government sponsored enterprises (GSEs) implemented the First Look initiative to encourage home ownership by allowing owner occupant homebuyers to purchase foreclosed properties owned by GSEs, during a window of up to 30 days, before other investors could make a bid on the property. Similar to Lambie-Hanson et al. (2019), we exploit the geographical variation in foreclosure sales owned by GSEs as an instrument to quantify the effect of housing investors.
Zooming in the distribution across zip codes over time, the share of First Look sold properties peaks around 2010 and then gradually declines after 2011 (Figure 2, top panel). In terms of geographical distribution, higher percentage shares are observed in the coastal areas, particularly in the South West. Importantly, areas with a high exposure to First Look properties saw a relatively steeper drop in the share of second-home buyers, when compared with less exposed areas (Figure 2, bottom panel). This finding is consistent with the purpose of the program which achieved its objective of reducing the share of investors in areas where the GSEs’ owned most of the foreclosed properties.
Figure 2. First Look Properties and Non-Primary Home Demand
Share of First Look Properties
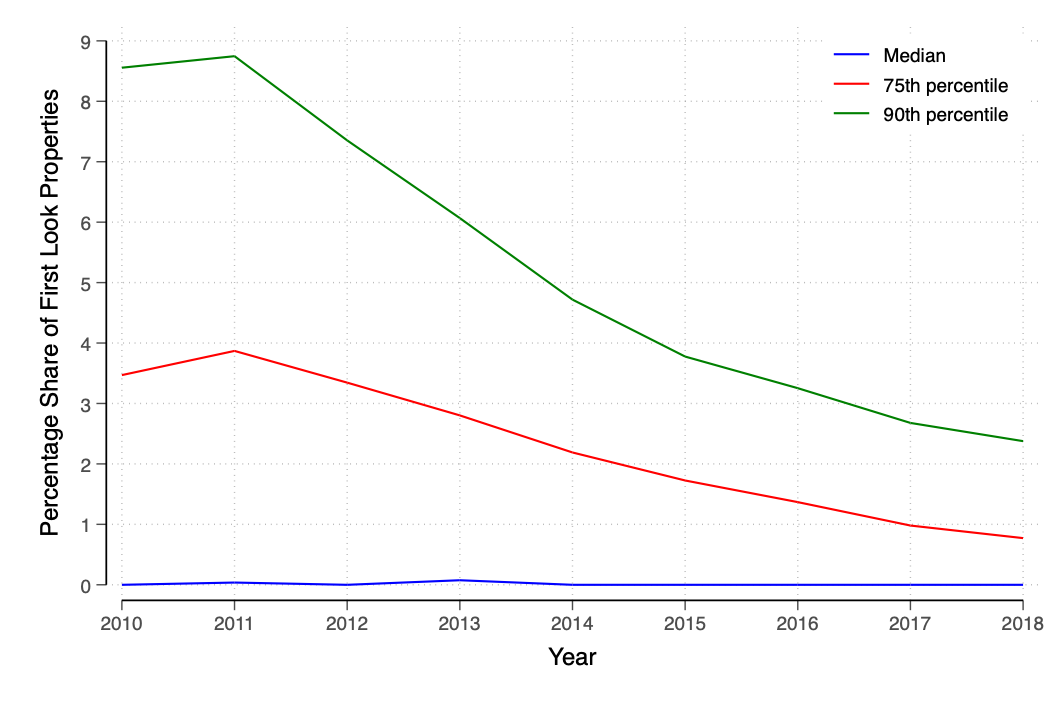
Share of Second-home Buyers
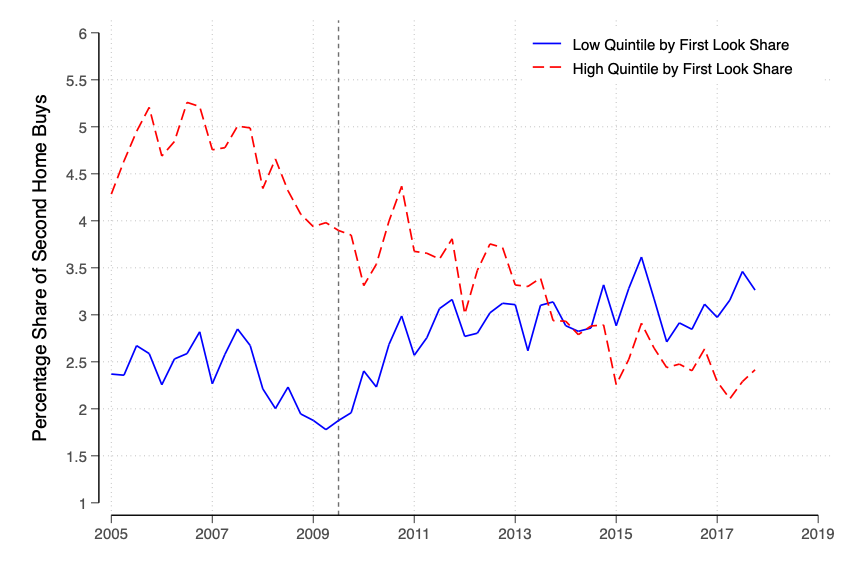
Note: Top panel presents the share of First Look properties in total sales, respectively, for the median, 75th, and 90th percentile zip code ranked quarterly. Bottom panel depicts the share of second-home buyers in total sales for the highest and lowest quintile zip codes ranked every quarter by the share of First Look properties.
In economic terms, the second-home investment demand has statistically significant impact on house prices and rents. For instance, a one percentage point increase in the instrumented share of second-home buyers is associated with 0.66 percent higher house prices, amplifying the boom periods. At the same time, a one percentage point rise in investment demand can lead to 0.5 percent lower rents in the subsequent period. This evidence is consistent with a buy-to-let logic of investment demand whereby investors purchase properties and subsequently increase the supply in the rental market.
Shadow banking
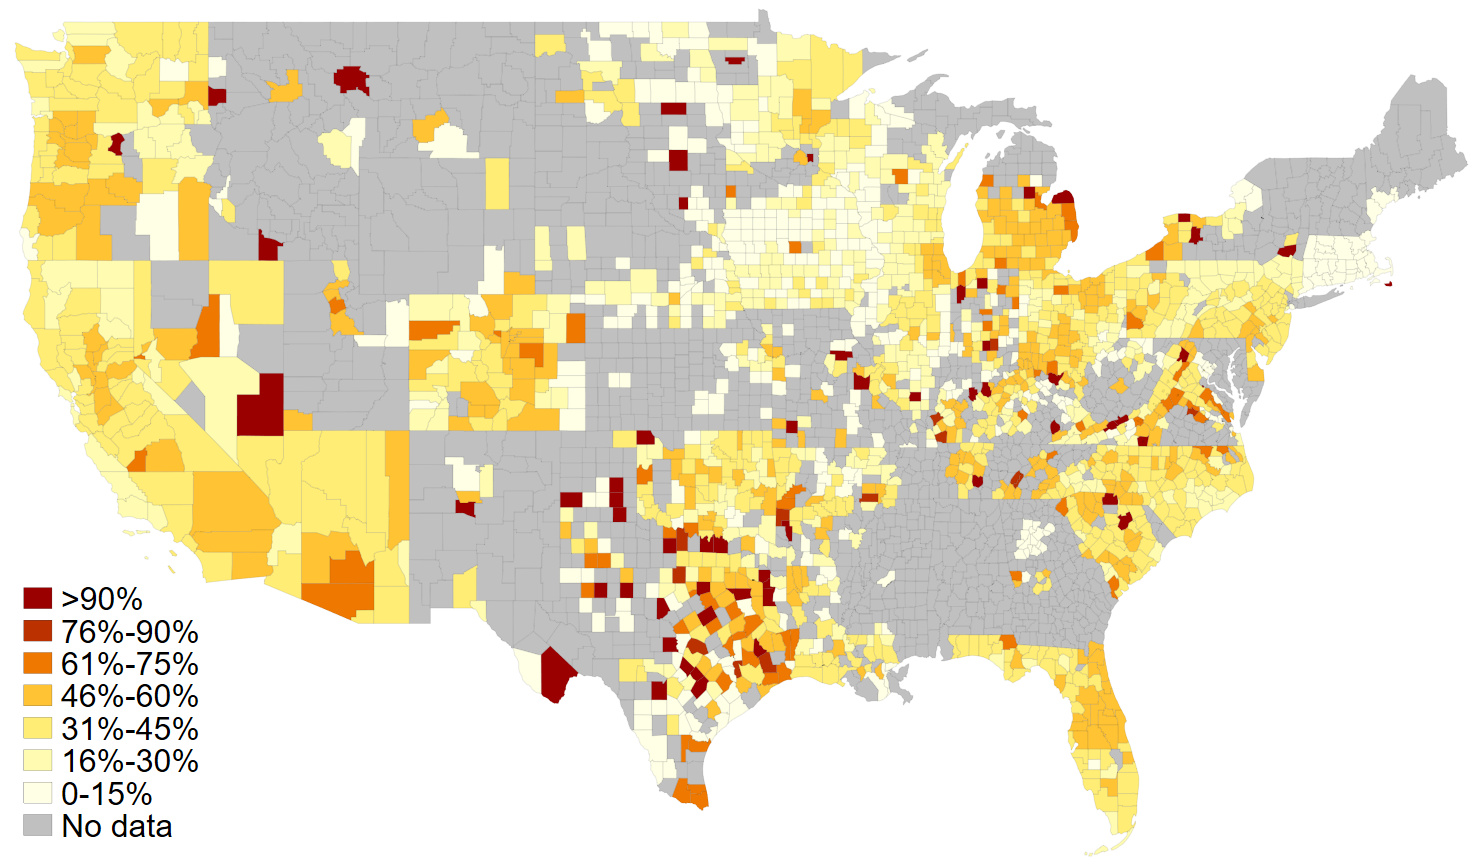
Naturally, with more than 60 percent of housing transactions being financed by loans, credit supply and credit shocks play a key role in housing market dynamics. First, housing investment is highly leveraged, creating risks for both homeowners and their lenders. This aspect has important implications for financial stability. Second, the housing cycle and household indebtedness have historically moved in tandem. This co-movement has been strengthened by the rapid growth of securitization and shadow banking activity in the early 2000s. After plummeting during the GFC, shadow banking activity has strongly rebounded over the past decade (Figure 3). Its rapid growth was partially driven by tighter banking regulation and the emergence of new technologies which allowed the arrival of online FinTech lenders (Buchak et al., 2018; Greenwood and Scharfstein, 2013).
In our analysis, we find that in areas with a high share of shadow bank lending, a one percentage point increase in second-home buyers is followed by a 0.5 percent increase in house prices during boom periods. In contrast, the effects are not statistically significant in the areas dominated by traditional banks. Similarly, a one percentage point increase in the fraction of second-home buyers in areas with a larger penetration of shadow banking activity is associated with about 5 percent slump in house prices during bust periods. At the same time, the effects of second-home purchases are much weaker in areas less exposed to shadow bank lending, leading to a 1.3 percent fall in house prices during recessions. The effects of various types of investments on house prices are consistently found 3-4 times larger in areas dominated by shadow banks, particularly during boom periods (Alter and Dernaoui, 2020).
Figure 3. Shadow Banking Activity across US Counties
In 2008
In 2018
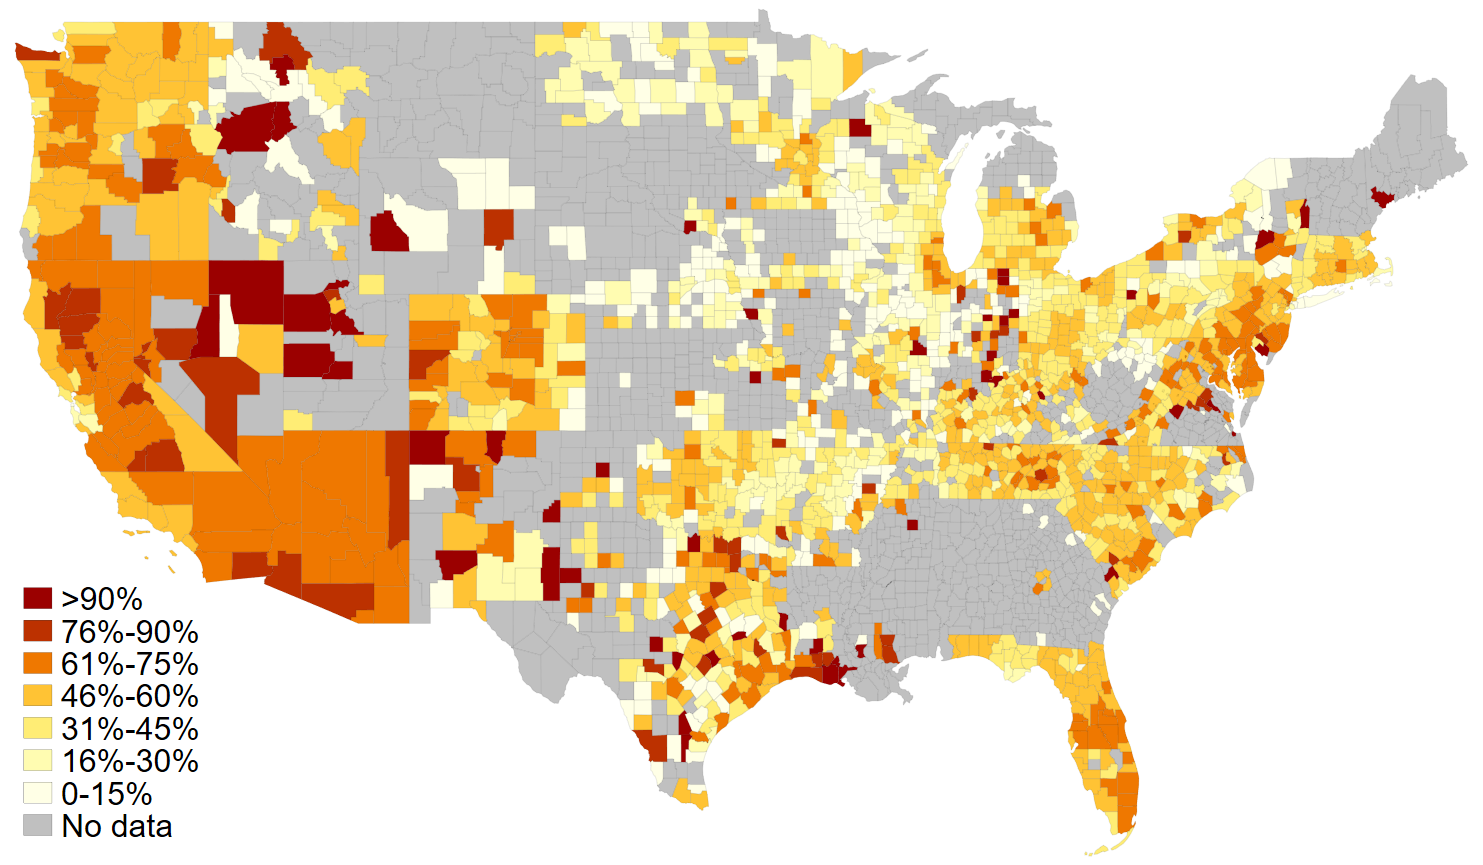
Note: “Shadow banking” refers to non-deposit taking financial institutions such as mortgage, finance, leasing and insurance companies.
Concluding remarks
In summary, we study the dynamics of investor composition using a unique and comprehensive dataset and document the peak of non-primary home investments in the aftermath of the GFC. Interestingly, areas with a higher share of investments experienced an amplified boom-bust housing cycle. More importantly, areas with a higher share of shadow bank lending have been associated with riskier mortgages and a more amplified house price cycle due to the presence of non-primary home transactions.
Our findings have several policy implications. Macroprudential, monetary, and fiscal policies can serve as key levers to mitigate excessive house price appreciation, housing affordability, and potential financial stability risks. In particular, our results are consistent with the development of a complete macroprudential policy toolkit for non-bank financial intermediaries, which can be appropriately utilized to limit risk-taking behavior and potential policy leakages.
This guest blog post was drafted by Adrian Alter, an economist at the International Monetary Fund, in the Monetary and Capital Markets Department, and Zaki Dernaoui, a PhD candidate at MIT Sloan, in the Finance Group.
*The views expressed in this blog are those of the authors and do not necessarily represent the views of the IMF, its Executive Board, or IMF management. Data were provided by Zillow through the Zillow Transaction and Assessment Dataset (ZTRAX). The results and opinions are those of the authors and do not reflect the position of Zillow Group, Inc.


