
War Finance and Bank Leverage: Lessons from History
This guest blog post comes to us from Antoine Martin* and Joshua Younger**.
*Antoine Martin is a senior vice president in the Federal Reserve Bank of New York’s Research and Statistics Group. The views expressed in this post are his and do not necessarily reflect the position of the Federal Reserve Bank of New York or the Federal Reserve System. Any errors or omissions are his responsibility.
**Joshua Younger is a managing director at J.P. Morgan Chase & Co. All views expressed in this forum are his own and may not align with those of the firm, but they are consistent with all research publications published under the firm brand for which he is listed as an author. J.P. Morgan reviewed this post prior to publication.
Congress’s legislative response to the coronavirus pandemic is expected to lead to a dramatic increase in government debt that, as a fraction of GDP, could reach levels not seen since World War II (WWII). Who will buy that debt and what could be the consequences of this indebtedness? How could it reshape the banking system and how might regulators respond? In this post, we take a look at U.S. government debt over the last 100 years to draw some lessons.
Congress’s Response to the Pandemic
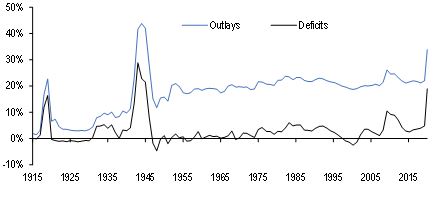
Fiscal policy has evolved almost as fast as the pandemic, with a slate of legislation passed in March and April designed to offset the negative economic impact of the public health emergency. As of June, the Congressional Budget Office (CBO) estimated that the cost of this response will total $2.4 trillion, roughly 79 percent of which will be new spending. With revenues likely to decline at the same time, the CBO in a separate report said it expects a budget funding gap of $3.7 trillion in FY2020 and $2.1 trillion the following year. As a result, government outlays and deficits relative to GNP are both nearing levels last seen during WWII, as shown on the next chart.
Chart: Federal outlays and deficits as a share of GNP increase dramatically
War financing: what happened to government debt around WWII?
There are several intuitive reasons to look back to the historical example of war financing when considering the economic impact of the COVID pandemic. In both cases, an urgent national project required a level of coordination of activity that generally cannot be achieved by the private sector. This often leads to fiscal policy that generates a large increase in the stock of Treasury debt. That was clearly the case in the 1940s, during which the marketable debt outstanding grew from 30 percent to 98 percent of GDP from Pearl Harbor to Victory over Japan (V-J) Day. The impact of COVID-19 on federal finance will likely not be quite as dramatic as WWII, in part because the debt-to-GDP level was already high before the pandemic. Nevertheless, CBO projections suggest that the stock of Treasury debt relative to economic output will reach comparable levels in the coming years.
How was all that government debt financed?
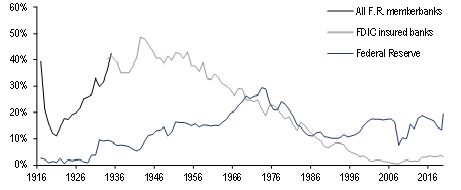
Much attention has been paid to the role of the Federal Reserve after WWII. Of the roughly $230 billion increase in interest-bearing Treasury debt (or 216 percent of 1940:Q4 GNP) between 1940 and 1945, more than 70 percent (or $163 billion, or 153 percent of 1940:Q4 GNP), was sold on the open market (that is, as marketable debt). A recent Liberty Street Economics post by Kenneth Garbade (and a related publication ) examines in detail the implementation and impact of yield curve control measures enacted during those years to support the financial aspects of the War effort. However, it should be noted that though Fed purchases were an important piece of the story and central to capping yields, they were not the primary source of demand. The private sector purchased more than 87 percent of the marketable debt sold from 1940-45, with commercial banks in particular absorbing 31 percent of net issuance, as compared to only 13 percent by the Fed, over that period. As a consequence, the percentage of marketable Treasury debt held by commercial banks increased to nearly 50 percent during the War Years, while the Fed never breached 12 percent over that period, as seen in the following chart.
Chart: The share of marketable Treasury debt owned by commercial banks during WW II was consistently much higher than the share owned by the Fed
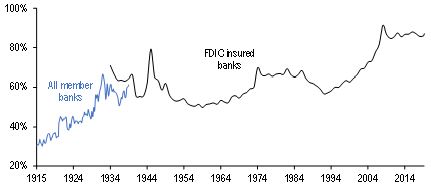
These purchases led to rapid growth in the balance sheets of both the Fed and of the U.S. banking system. Over 1940 to 1945, total assets held by commercial banks more than doubled in absolute terms and reached nearly 80 percent of GNP, as seen in the next chart.
Chart: Total assets held by commercial banks as a fraction of GNP increased significantly during WWII
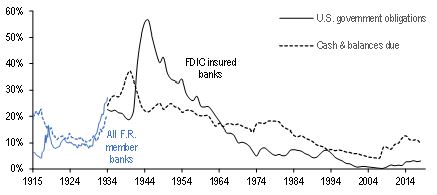
Most of the increases in commercial bank assets were driven by the expansion of the Fed’s balance sheet, and the associated increase in bank reserves, as well as acquisitions of Treasury securities. By the end of the War, these two assets accounted for nearly 80 percent of their balance sheets, as seen in the next chart.
Chart: The share of Treasury securities held on FDIC-insured banks’ balance sheets increases dramatically during WWII
The large increase in Treasury holdings by commercial banks had striking implications for their leverage ratio. Total leverage ratios, measured as equity capital to total assets, among commercial banks started the 1940s around 10.3 percent, but declined to a low of 5.5 percent by 1945, as seen on the next chart.
Chart: Banks’s capital relative to assets declines during WWII
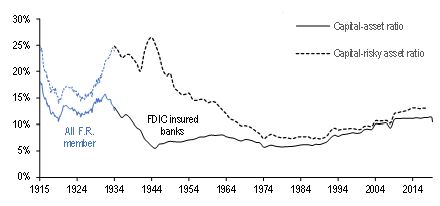
The drastic reduction in the leverage ratio eventually led to a dilemma for regulators. Capital adequacy requirements put in place by the Federal Deposit Insurance Corporation (FDIC) during the 1930s set a 10 percent minimum for equity relative to all balance sheet assets, including cash and Treasuries. This was a change from minimum capital-to-deposit ratios, which prevailed prior to the Great Depression. The new equity-to-asset ratio rule was not binding for several years after its creation, but this changed quickly with the rapid expansion of commercial bank balance sheets in response to the massive increase in government debt. To avoid a disorderly reduction in assets that would likely harm the war effort, the Federal Reserve revised its requirements, defining a new equity-risk asset ratio that excluded cash and Treasuries and setting a 20 percent minimum requirement. (More detail about these events can be found in papers by Malcolm Alfriend, Karlyn Mitchell, John Walter, and Joseph Haubrich.)
The immediate post-War years are also an instructive epilogue to this story. Neither total nor risk-based leverage ratios recovered as quickly as debt-to-GDP in the years immediately following V-J Day. In fact, risk-based leverage ratios declined in the late 1940s and 1950s as strong growth led to increased private sector demand for credit. This development led the Federal Reserve to revise capital adequacy requirements again in 1952, this time assigning capital requirement to specific assets on the basis of their perceived risk. The Fed also added new liquidity requirements that considered the liability side of the balance sheet in 1956. These rules were designed to maintain the stability of the banking system without restricting the system’s ability to facilitate the post-War economic recovery—and the requirements did not return to total leverage-based constraints.
To sum up
The last time the United States had levels of debt to GDP as high as those expected in the coming years was during WWII. Among other things, the 1940s show that, though the Fed certainly played an important role, private market participants were instrumental in financing the war effort. Commercial banks in particular played a key role, which lead to large increases in the sizes of their balance sheets and a dramatic decline in the leverage ratio, as measured by capital over assets. These changes required a more dynamic approach to capital adequacy, and regulators adapted to this unprecedented situation by excluding the safest assets, such as cash and Treasury securities, from the leverage ratio.