U.S. Banks to Maintain Dividends for Now, Following Pre-COVID Stress Test
Most of the largest U.S. banks announced Monday that they will continue to pay dividends in the third quarter at the same level as the second quarter. This news comes just two business days after the Federal Reserve announced the results of its annual stress test and an unprecedented “sensitivity analysis” estimating the potential impact of different economic recoveries from the COVID recession on bank performance. Based on these scenarios, the Fed announced a number of temporary restrictions on dividends and other corporate actions.
The Fed’s stress test forecasted $433 billion in loan losses for the 33 largest banks under a severely adverse scenario that it announced in February, prior to the COVID crisis (see page 19). The test extends nine quarters, through March 2022.
Losses are much worse under all of the Fed’s scenarios in the sensitivity analysis, which takes COVID into account. The analysis forecasts $560 billion in loan losses under the most optimistic post-COVID scenario, which assumes a rapid “V-shaped” recovery. Projected loan losses are just over $700 billion in a “U-shaped” recovery and $680 billion in a “W-shaped” recovery. For comparison, the 33 banks had $10.4 trillion in risk-weighted assets and $1.2 trillion in capital at the end of 2019 (see page 23).
The Fed uses the results of its stress test to determine large banks’ capital requirements every year. However, it plans to “assess banks’ capital plans more frequently during this time of uncertainty” (see page 1). It will require banks to re-submit their capital plans later this year based on revised scenarios that the Fed will provide. The results could reveal larger capital deficits and lead to more aggressive restrictions on corporate actions.
Maintaining dividends
On Thursday, the Fed said it would allow banks to pay common stock dividends in the third quarter, but no more than their average income over the prior four quarters and no more than they paid in the second quarter, whichever is less. It won’t allow share repurchases in the third quarter; the eight U.S. global systemically important banks (G-SIBs) voluntarily suspended share repurchases in the second quarter.
All but one of the eight G-SIBs said Monday that they plan to maintain their dividends in the third quarter at prior levels. Wells Fargo, which appears to be the only G-SIB whose recent dividends have exceeded its average net income, said in a statement that it expects second-quarter losses will exceed first-quarter losses, and that it plans to reduce its dividend.
Goldman Sachs hinted that it may have to rebuild capital to maintain its dividends. The company is the only G-SIB whose capital is below the Fed’s required buffer based on the stress test results—its common equity tier 1 capital (CET1) ratio was 12.5% at the end of March, compared to the 13.7% the Fed will require it to reach by October 1. However, Goldman said it has recently brought the ratio back over 13%.
“We have a track record of rebuilding capital when necessary,” its chairman and CEO, David Solomon, said in the press release. “We fully intend to continue this dynamic capital management while helping our clients continue to navigate challenging markets.”
As shown in the below table, there have been significant changes in net income over the past four quarters. However, those declines have not translated into changes in the dividends expected to be paid in the third quarter. Analysts forecast that 27 of the 33 banks will report second-quarter net income below the average of the four prior quarters. Twenty-five of the 33 banks have announced, or are forecasted, to pay dividends in the third quarter equal to those they paid in the second quarter.
Dividend History and Net Income Analysis (Source: Bloomberg)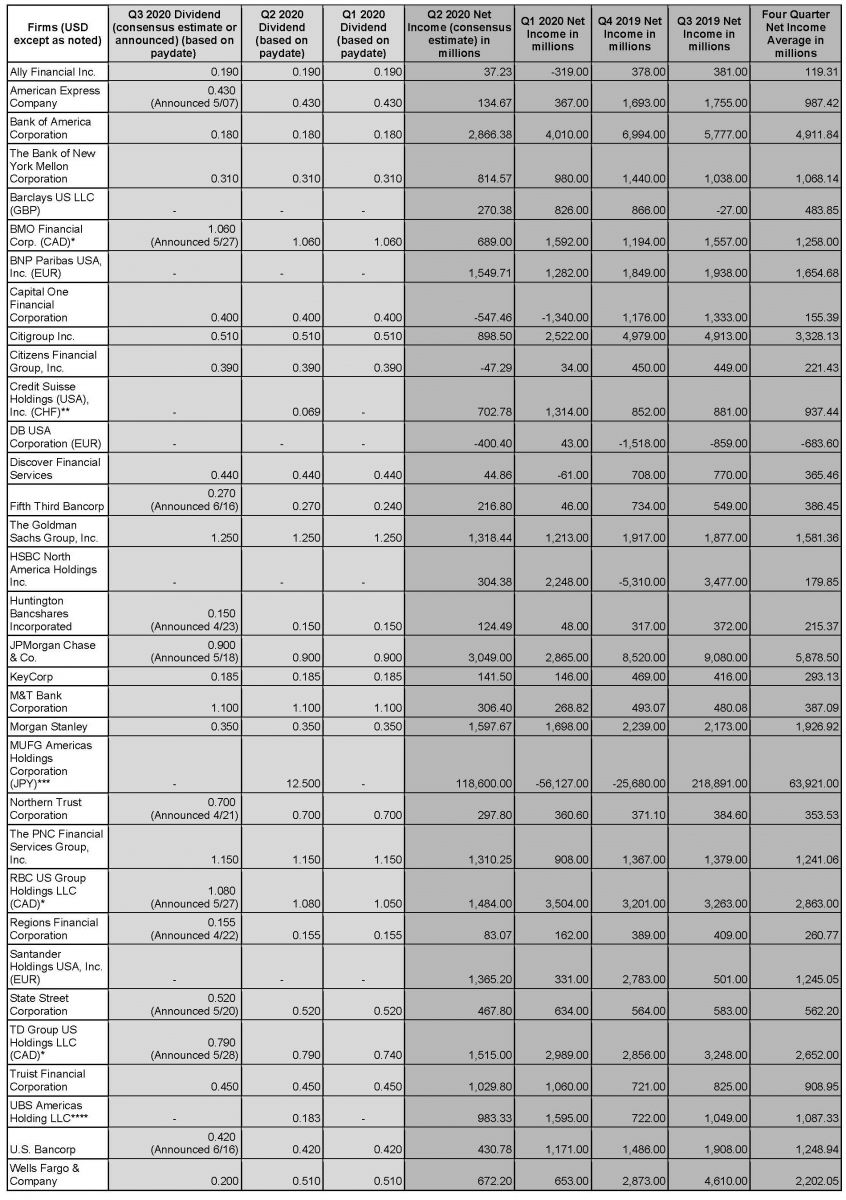
*Due to differences in the Canadian Fiscal Calendar the quarters for these companies end dates are as follows: Q2 2020 (4/30/2020), Q1 2020 (1/31/2020), Q4 2019 (10/31/2019), Q3 2019 (7/31/2019)
**Credit Suisse Holdings (USA), Inc. announced two dividends on 4/09, .0694 CHF payable 5/11 and .1388 CHF that has no paydate
***MUFG Americas Holdings Corporation announced a dividend of 12.50 JPY on 5/15 that has no paydate / Japanese Fiscal Calendar differs such that Q2 2020 is Q1 2021 (6/30/2020), Q1 2020 is Q4 2020 (3/31/2020), Q4 2019 is Q3 2020 (12/31/2019), Q3 2019 is Q2 2020 (9/30/2019)
****UBS Americas Holding LLC announced two dividends on 4/09, .1825 USD payable 5/07 and .365 USD that has no paydate
The Fed’s bank dividend policy has been controversial within the central bank. Fed Governor Lael Brainard released a statement critiquing the policy. “[Dividend] payouts will amount to a depletion of loss absorbing capital,” she wrote. “This is inconsistent with the purpose of the stress tests, which is to be forward looking by preserving resilience, not backward looking by authorizing payouts based on net income from past quarters that had already been paid out.”
Fed Governor Randal Quarles, who is also the Fed’s vice chairman for supervision, explained his support for the measures. “[The] approach builds on our existing standards on capital distributions, which restrict distributions based on recent income,” he wrote. “If the circumstances warrant, we will not hesitate to take additional policy actions to support the U.S. economy and banking system. I support today’s actions to ensure banks remain an ongoing source of strength to the U.S. economy.”
Stress test revisions: Setting the new Stress Capital Buffer
The Fed introduced a new method for setting capital requirements for the largest banks in this year’s stress test (see the staff memo, page 7). Previously, the Fed required these banks to meet two sets of standards: the Basel III standards (agreed to by international regulators), and the results of its annual stress test. The new method essentially merges the two.
The Fed continues to require the largest banks to hold CET1 equal to 4.5% of their risk-weighted assets, at minimum. G-SIBs are also required to hold an additional buffer based on their systemic importance, currently ranging from 1.0% to 3.5% for the eight U.S. G-SIBs.
The new part is the “stress capital buffer.” It is based on each bank’s net loss in the stress test--the difference between the bank’s starting and minimum projected capital ratios--plus four quarters of planned dividends as a percentage of risk-weighted assets. The stress capital buffer can’t be less than 2.5%, the level of the capital conservation buffer under Basel III.
Any bank whose capital ratio falls below the sum of the 4.5% minimum, the individual G-SIB surcharge, and the individual stress capital buffer will be subject to automatic restrictions on capital distributions.
In its stress test report, the Fed reported each bank’s net loss. The Fed confidentially told each bank its individualized stress capital buffer, including projected dividends.
Most of the largest banks publicly disclosed their stress capital buffer on Monday. For five of the G-SIBs, their net losses in the stress test were low and the Fed set their stress capital buffer at 2.5%. The Fed set JP Morgan Chase’s stress capital buffer at 3.3%, Morgan Stanley’s at 5.9%, and Goldman Sachs’s at 6.7%.
The first figure below shows each G-SIB’s total capital requirement, based on Monday’s announcements, compared to their actual CET1 ratios reported for the end of the first quarter. The second figure shows the cushion or deficit based on those figures. Banks have until October 1 to resolve any deficits.
2020 stress test: Aggregate results
This year, the Fed analyzed 33 firms in its stress test. The severely adverse scenario consisted of 28 variables, including a maximum drop in gross domestic product (GDP) of about 8.5% from the pre-recession peak and a jump in unemployment to a high of 10%.
The results projected aggregate losses of $552 billion for the 33 firms, including $433 billion in loan losses, $6 billion in securities losses, $85 billion in trading and counterparty losses, and $29 billion in other losses. Nine-quarter loan loss rates were 6.3% in aggregate. The Fed projected the aggregate CET1 ratio for the 33 companies to fall from 12.0% at the end of 2019 to 10.3% in March 2022, hitting a minimum of 9.9% during the period (see page 23).
The results aren’t directly comparable to the Fed’s 2019 stress test, because it now requires smaller banks to conduct the test every two years. But the Fed reported that losses were roughly comparable for the 18 largest banks that participated in both tests. These banks had projected losses of $410 billion in the 2019 test and $433 billion in the 2020 test (see page 1).
The Fed made other important changes in its methodology. It now assumes that a bank’s assets won’t grow over the projection horizon and that a bank won’t pay dividends on common stock, or issue new stock. These changes significantly improve banks’ projected capital ratios (see page 22). Dividends in recent stress tests prior to the change in methodology amounted to about 70 basis points for GSIBs and 100 basis points for other banks, according to a paper last year (see page 10). To be sure, the new methodology takes back much of that benefit by adding four quarters of dividends in computing the stress capital buffer.
2020 sensitivity analysis: Aggregate results
In addition to the stress test, which uses scenarios that the Fed began constructing in late 2019, the Fed released a supplemental sensitivity analysis to account for the emerging economic impacts of the COVID pandemic.
Due to the uncertain economic implications of the COVID pandemic, the sensitivity analysis includes three hypothetical scenarios based on potential recovery paths. In comparison to the severely adverse scenario outlined in the stress test, each of the pandemic scenarios uses similar methods and analyzes the same 33 firms. Unlike the stress test, the Fed did not disclose firm-specific data about the sensitivity analysis.
The sensitivity analysis also incorporates higher peak unemployment and larger decreases in GDP, along with targeted adjustments. Unlike the stress test, it assumes bank balance sheets will grow: It assumes a 12% increase in outstanding corporate loans and a 30% increase in risk-weighted assets for the first quarter of 2020.
To adjust for industry-specific stress, the Fed incorporated a one-letter-grade credit downgrade for loans in impacted sectors.
The Fed also included temporary amendments regarding tax loss carrybacks and carryforwards in the tax code from the CARES Act into its calculation of post-stress capital.
The three scenarios are “V-shaped,” “U-shaped,” and “W-shaped”:
-
The V-shaped scenario begins with a deep recession in the immediate first two quarters, with real GDP contracting by 31.5% (annualized) and unemployment jumping to 19.5%. This is followed by a rapid recovery in the third and fourth quarter of 2020, resulting in above-trend GDP growth in 2021 and 2022 and a decline in unemployment that remains above the low rate achieved before the pandemic. In this scenario, the Fed projects the aggregate CET1 ratio will fall from 12% at the end of 2019 to as low as 9.5% during the nine-quarter period (see page 2). The Fed projects the aggregate nine-quarter loan loss rate at 8.2%.
-
The U-shaped scenario has a prolonged recession in which the unemployment rate peaks at 15.5% and maintains that level for a number of quarters before levelling off above the actual March 2020 rate. In addition, GDP fails to rebound meaningfully and does not reach its previous trend. As a result, the projected CET1 ratio falls as low as 8.1%. The projected nine-quarter loan loss rate is 10.3%.
-
The W-shaped scenario has an initial recovery that is stymied by a second outbreak and resulting downturn. In the first phase, real GDP contracts by 37.5% (annualized) and unemployment increases to 16% in June 2020. However, GDP growth rebounds strongly in the second half of 2020, returning nearly to pre-crisis levels. This recovery is halted by a second outbreak and lockdown. In response, GDP falls 12% in the first quarter of 2021 and unemployment rises again as high as 14%. The second recession is more shallow but longer. The projected CET1 ratio falls as low as 7.7% and the projected nine-quarter loan loss rate is 9.9%. Beyond the projection horizon, the loan loss rates are persistently higher and CET1 ratios are lower than in the other scenarios.
Scenario Variables and Aggregate Results
|
Scenario |
Peak Unemployment |
Peak-to-trough GDP Change |
Lowest 10-Year TSY Rate |
Minimum CET1 Ratio** |
Loan Loss Rates* (est. Q1 2020-Q1 2022) |
|
Severely Adverse |
10.0 |
-8.5 |
0.7 |
9.9 |
6.3 |
|
V-Shaped |
19.5 |
-10.0 |
0.8 |
9.5 |
8.2 |
|
U-Shaped |
15.6 |
-13.8 |
0.6 |
8.1 |
10.3 |
|
W-Shaped |
16.0 |
-12.4 |
0.5 |
7.7 |
9.9 |
*Note that projected loan losses across scenarios are the main driving force of differences in the CET1 ratio
**The aggregate CET1 ratio at the end of 2019 was 12.0%
Key takeaways from stress test and sensitivity analysis
The results of the stress test and sensitivity analysis display a broad range of potential outcomes. Banks’ projected CET1 ratios remain significantly above regulatory minimums in both the severely adverse scenario of the stress test and the V-shaped scenario of the sensitivity analysis. The bottom 25th percentile firm-level post-stress CET1 ratio is 8.0% for the severely adverse scenario and 7.5% for the V-shaped scenario. Both are significantly above the 4.5% minimum, although some banks may fall below their buffer levels and be subject to automatic capital restrictions under those scenarios.
On the other hand, the Fed projects CET1 ratios will remain above minimum requirements in aggregate but will fall to dangerous levels for many banks in the U-shaped and W-shaped scenarios. The bottom 25th percentile firm-level post-stress CET1 ratio is 5.5% in the U-shaped scenario and 4.8% in the W-shaped scenario. This suggests that several banks could break the 4.5% minimum; many others could break their buffers and be subject to automatic capital restrictions under those scenarios.