European and Japanese G-SIB Report Second-Quarter Results
Access our live “financial-intervention” tracker, to keep up with the latest financial-crisis fighting interventions by central banks, fiscal authorities, and international organizations here.
In the midst of the COVID-19 lockdown, earnings beat expectations for most European and Japanese banks in the second quarter due to a surge in non-interest income that offset rising loan-loss provisions.
In the blog post “Banks’ Second-Quarter Results Boosted by Non-Interest Income and Official Support”, we analyzed US large banks’ second-quarter earnings. Recently, European and Japanese banks also updated their earnings. In this blogpost, we analyze the results of 12 European global systemically important banks (G-SIBs, as of 2019) and three Japanese G-SIBs for the three months through June 30. (This period represents the second quarter of the 2020 financial year for European banks and the first quarter of the 2021 financial year for Japanese banks).
European G-SIBs: 12 financial institutions
|
Reporting Date |
Firm name |
|
7/24 |
|
|
7/29 |
|
|
7/30 |
|
|
7/31 |
|
|
8/3 |
|
|
8/6 |
|
Japanese G-SIBs: 3 financial institutions*
|
Reporting Date |
Firm name |
|
7/29 |
|
|
7/31 |
|
|
8/4 |
* Japanese financial institutions have not updated their regulatory capital information.
Given the deep recession and prolonged COVID-19 crisis, earnings reports can serve as a thermometer of the economy and the financial system.
Similar to their US peers, the results were not as devastating as the market expected. While sluggish household and firm borrowing limited lending activities, financial institutions with investment banking businesses benefited from active bond issuance and the strong stock market. Most European banks adopted the new IFRS9 accounting standard and set aside higher expected credit loss (ECL) provisioning for future loan losses. Many of those banks took advantage of the transition treatment to ease the impact of the losses on their capital.
In general, the economic shocks that COVID-19 has created so far in Europe and Japan have been somewhat milder than those in the US. For instance, the euro area unemployment rate was at 7.8 % in June 2020, compared to 11.1% of the US. In the second quarter of 2020, gross domestic product (GDP) dropped by 12.1% in the euro area and 32.9% in the US. Although Japan’s GDP dropped by 21.7% and consumer confidence hit its lowest on record, the death rate caused by the COVID-19 has been much milder than the US and the economy has begun to reopen. Still, the outlook may not be promising for Japan’s finance sector. Banks have already been challenged by prolonged low interest rates and low profitability.
In this blogpost, we analyze earnings reports in terms of six areas: 1) CET1 capital ratio, 2) Net income and revenues, 3) Non-performing loans, 4) Loan loss provisioning, and 5) Market reaction and equity price.
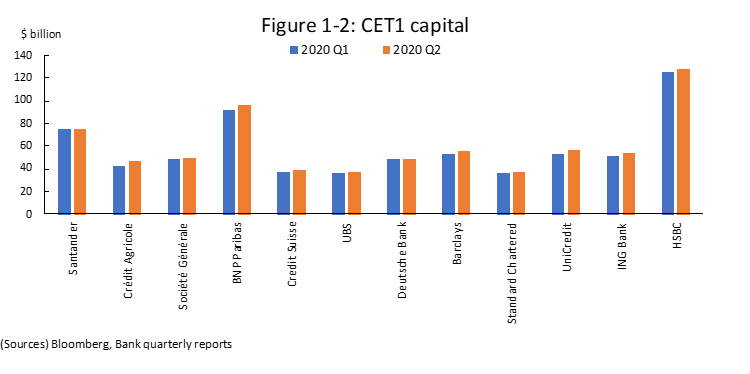
1. CET1 Capital Ratio
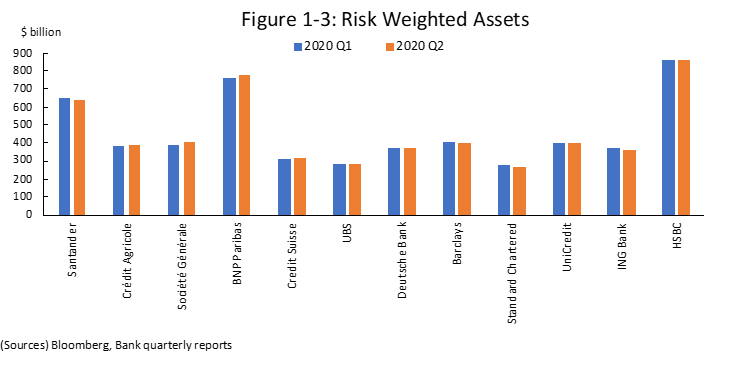
The common equity Tier 1 (CET1) capital ratio, an important regulatory indicator of bank solvency, increased quarter-on-quarter (QoQ) for 11 of the 12 financial institutions; the outlier was Société Générale (Figure 1-1). CET1 capital (the numerator) increased for all firms while risk-weighted assets (RWA, the denominator) decreased for 7 firms (Figure 1-2 and 1-3).
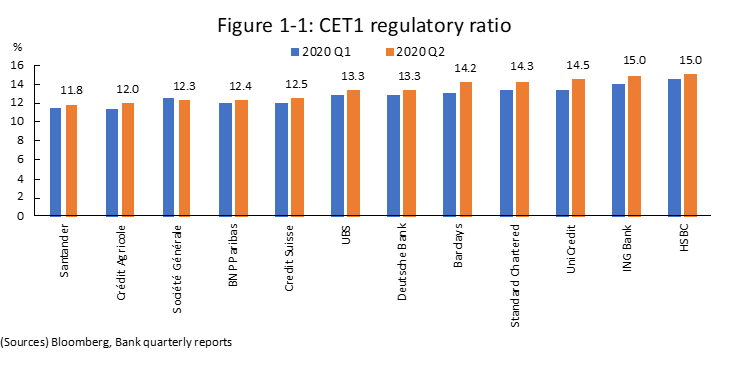
Several European banks attributed the increase in CET1 to the suspension of capital distributions. For instance, HSBC noted that the cancellation of the quarterly unpaid dividend of $3.4 billion contributed to the increase of its CET1 capital.
As noted in our recent blog post, European and UK regulators have called on banks to suspend dividends and other capital distributions. In the UK, for example, the Prudential Regulation Authority asked the seven largest systemic UK banks to suspend dividends and share repurchases until the end of 2020 and to refrain from paying cash bonuses to senior executives. Switzerland and Japan have not introduced such measures.
Barclays and a few other financial institutions also noted that the IFRS 9 transitional relief contributed to the increase in CET1 capital.
While improved CET1 ratio for most financial institutions were driven by the surge in CET1 capital, some also managed to decrease their risk-weighted assets. For instance, the significant decrease in RWA for ING contributed to a 0.9% boost in its CET1 ratio. ING explained that the adoption of the standardized approach for sovereign exposures (0% risk weights for sovereign debts issued in domestic currency) and the amendments of EU regulations No 575/2013 (CRR) and 2019/876 (CRR II) (so-called “CRR quick fix”) led to the decrease in its credit risk, particularly for exposures to small business and infrastructure loans.
Some financial institutions attributed the increase in RWA to the surge in market risk.; for example, while overall RWA decreased, Standard Chartered said that its market risk RWA increased by $2 billion due to higher levels of Financial Markets activity, with increased value-at-risk from elevated market volatility.
Meanwhile, the regulatory required capital ratios have decreased for some banks, mainly due to the release of countercyclical buffers and capital conservation buffers (see the blog post here). Some banks reported the resulting declines in their capital requirements. For instance, UBS reported that the buffer release by the Swiss National Bank and several other countries led to a 29 basis-point reduction in its CET1 capital requirement.
Under Basel III, all banks must hold high-quality capital equal to 4.5% of their risk-weighted assets, plus a 2.5% capital conservation buffer (CCB). The purpose of the CCB is to encourage banks to conserve capital. When the buffer is breached, banks must limit bonuses to managers and distributions to shareholders.
Before the current crisis, about a dozen countries had also imposed a countercyclical capital buffer on their banks (CCyB). The CCyB is a buffer under Basel III that countries can build during boom times and draw down during busts to absorb losses and mitigate the increase in risk-weighted assets; they may set it as high as 2.5%. The Basel III CCyB is calculated as the weighted average of the buffers in effect in the jurisdictions to which banks have a credit exposure. Furthermore, jurisdictional reciprocity will be applied in the context of internationally active banks. Among jurisdictions where G-SIBs domicile, France, Germany, and UK have lowered their CCyB while Switzerland lowered its sectoral CCyB targeted at residential mortgage loans from 2.5% (Figure 1-4).
Figure 1-4: Major jurisdictions’ actions and statements on CCyB
|
France |
|
|
Germany |
|
|
Italy |
|
|
Netherland |
|
|
Spain |
|
|
Switzerland |
|
|
UK |
|
2. Net Income and Revenues
Earnings rose for nine of the 15 firms, stayed roughly the same for one firm, and fell for the other five, compared to the first quarter. However, the results were better than market expectations (Figure 2).
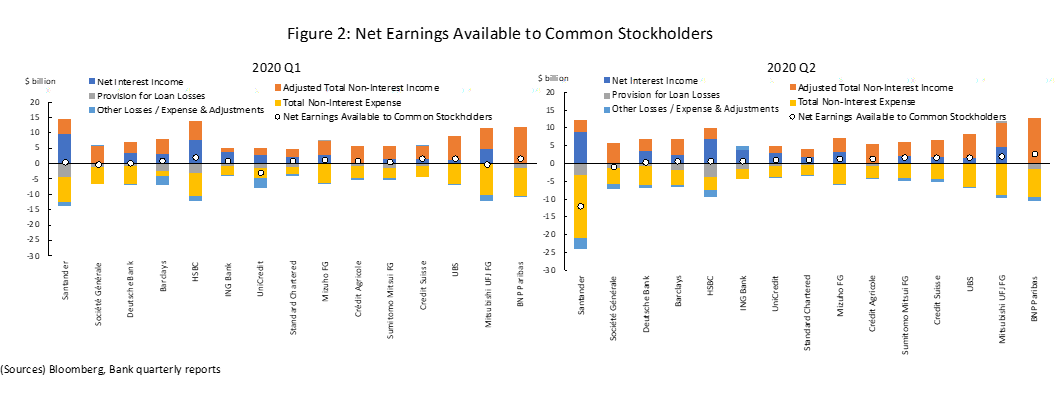
Robust net earnings were backed by strong non-interest income. As well as their European peers, trading profit surged, particularly for the G-SIBs, due to the higher client trading activities induced by wider trading spreads in volatile financial markets as clients repositioned their portfolios.
Some financial institutions noted that their equity and fixed-income underwriting businesses also contributed to the rise in non-interest income; given the attractive low interest rates, clients’ demand for bond issuance has been growing. A few banks, including Deutsche Bank, noted the improvement in their cost management as well.
3. Non-Performing Loans
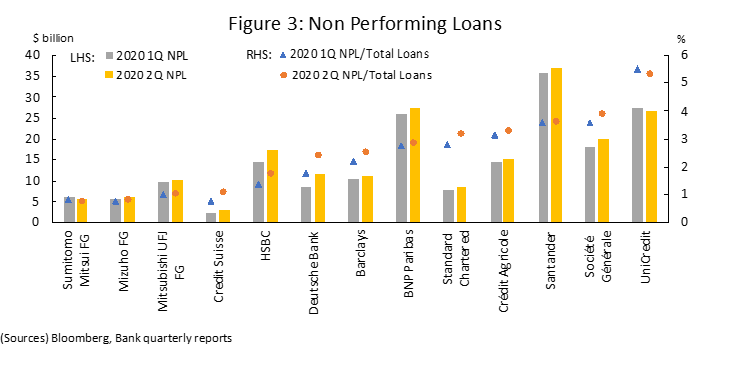
While banks’ earnings were stronger than expected, non-performing loans (NPLs) increased 7.0% in aggregate for the 13 banks compared to the first quarter (Figure 3). The ratio of NPLs to total loans increased for nine of the 10 financial institutions. Many banks noted that in addition to small and medium-sized corporate borrowers, commercial real estate, aviation, restaurants and leisure, retail, and energy-sector borrowers face severe challenges.
However, reported nonperforming loans would have been worse if banks had not provided relief to many borrowers, under the cover of accounting and other forbearance provided by jurisdictions in response to the COVID-19 pandemic. Many loans went under deferral programs or had their terms modified. (See here for more details on Loan Modifications, Non-Performing Loans, and Accounting relief).
The European Central Bank (ECB) has confirmed supervisory flexibility regarding the treatment of NPLs. For example, the ECB discourages banks from automatically classifying loans to borrowers who are unable to meet payments because of the pandemic. The ECB expects banks to take advantages of government guarantees. Furthermore, ECB is reportedly considering adopting bad banks, which are asset management companies that acquire bad loans (see our related blog post here). Other jurisdictions have also adopted similar forbearance and moratorium policies.
Banks varied widely in the details they reported on the impact of payment deferrals and other COVID-19 relief. In general, those with large retail banking businesses were more subject to the supervisory forbearance. For instance, Deutsche Bank reported over €17 billion in loans that were subject to moratoria, forbearance measures, and public-guarantee schemes.
4. Loan Loss Provisioning
For the 12 financial institutions combined, the loan loss provision decreased by 3% compared to the first quarter (Figure 4-1). The ratio of loan loss provisions to total loans increased for half of the banks.
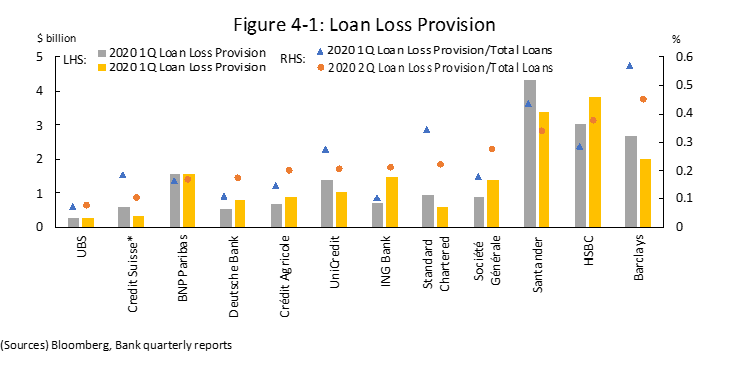 ING experienced a particularly large increase; its loan loss provision doubled from the previous quarter. According to the Financial Times, ING was one of the largest lenders to Wirecard, a German payment firm that filed for insolvency in late June amidst scandal.
Some of the increases in loan loss provision for 23 European banks could be attributed to the new forward-looking credit loss standard in IFRS9. (Unlike most European banks, Credit Suisse reported its consolidated financial report under US GAAP; thus it adopted the current expected credit losses (CECL) standard, the new forward-looking standard in the US. Japanese banks report their consolidated financial reports under J-GAAP, which has not incorporated a forward-looking standard.)
Under IFRS9, if the credit risk has not increased significantly from the loan origination (Stage 1), banks recognize allowances based on 12 months of expected losses. However, if the credit risk has increased significantly (Stage 2) and if the loan is credit-impaired (Stage 3), the standard requires allowances based on lifetime expected losses (Figure 4-2). An ESRB paper and others argue that as the exposures transfer from Stage 1 to 2, there will be a “cliff effect” in loan loss provisions due to the changes in time horizon. They worry that this could lead to procyclicality in the financial system.
Figure 4-2 Expected Credit Loss Model in IFRS9 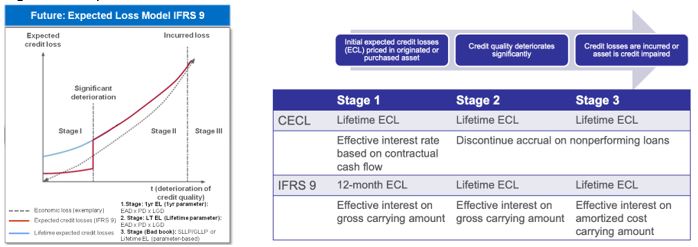
(Sources) Meyer and Pohlmann (2014) and Maher (2019)
Second, the ECL in IFRS9 is forward-looking and “probability-weighted” and require banks to use “reasonable and supportable Information” to quantify credit losses. In 2015 guidance published by the Basel Committee on Banking Supervision (BCBS), banks are expected to assess and measure credit risk to the particular lending exposure using the information of past events, current conditions, and forecasts of future economic conditions. Under the increased uncertainty in the COVID-19 crisis, combined with the aforementioned stages features, some were concerned about the unpredictable negative impacts on bank capital.
Recognizing these concerns, the International Accounting Standards Board (IASB), the accounting setter of the IFRS9, and various authorities in different jurisdictions have announced measures to mitigate the negative impacts (see related blog post here). Many jurisdictions and authorities have emphasized that banks should not take a mechanical approach to moving credits into Stage 2 (significant increase in credit risk, “SICR”) in cases where borrowers are affected by the pandemic.
Figure 4-3: Major actions on Expected Credit Loss Accounting
|
IASB |
|
|
IOSCO |
|
|
European Union |
|
|
France |
|
|
Germany |
|
|
Netherland |
|
|
Spain |
|
|
UK |
|
Source: Yale Program of Financial Stability, Institute of International Finance
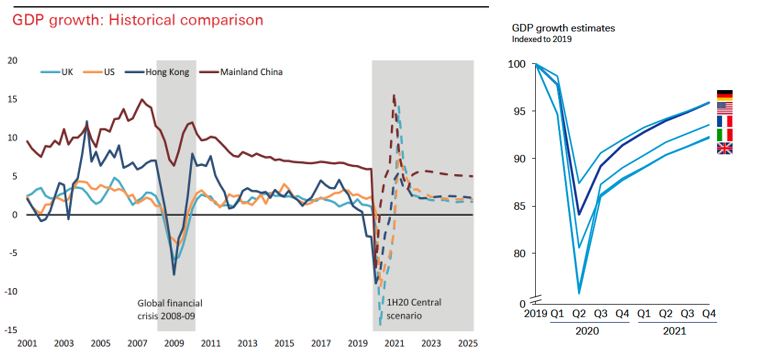
Meanwhile, some bank reports indicated that they expect a “V”-shaped recovery as their central economic scenario in their ECL models (Figure 4-4). For instance, HSBC noted that “[m]inimal long-term damage to economic prospects is expected, allowing economic growth across our key markets to return to forecast trend rates” and noted that the V-shape recovery forecast reflected the unique nature of the pandemic lockdown.
If the actual economic recovery in the third quarter is not as rosy and the recovery takes an “L” shape, banks may have to adjust their forecasts and further increase loan loss provisions.
Figure 4-4: GDP growth estimates by HSBC and Deutsche Bank
(HSBC) (Deutsche Bank)
![]() (Sources) Bank quarterly reports
(Sources) Bank quarterly reports
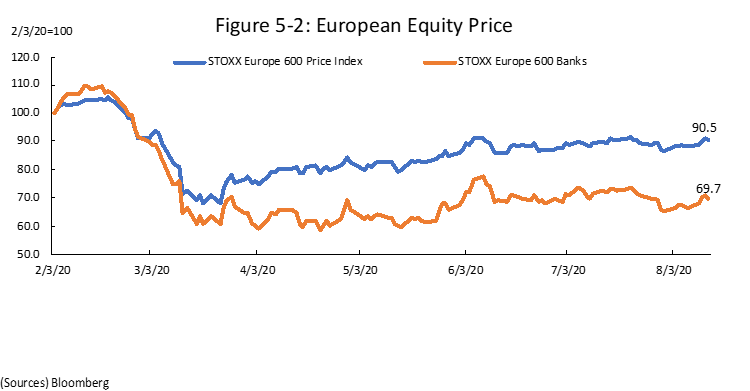
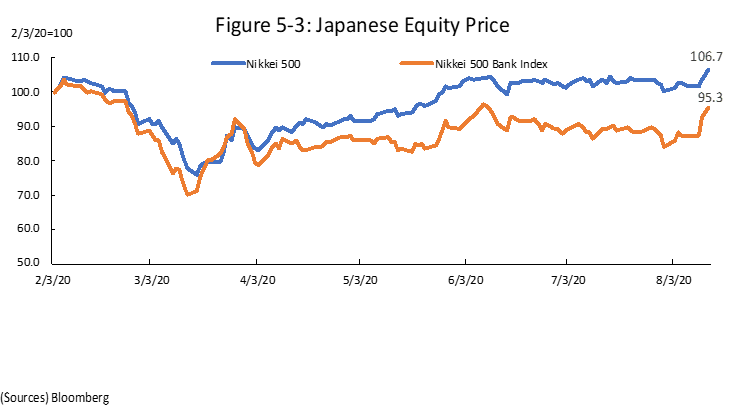
5. Market reaction and equity prices
The earning reports, overall, were better than market participants had expected. Figure 5-1 exhibits the differences between Bloomberg’s consensus estimates and the actual adjusted earnings per share (EPS); most banks outperformed the market estimates, sometimes by wide margins.

However, market prices suggest that the financial sector still faces many significant challenges. Figures 5-2 and 5-3 show financial firms’ slow recovery in equity prices, while the STOXX Europe 600 and Nikkei 500 benchmark indexes have been showing robust recovery. The low rate that is likely to persist both in Europe and Japan for coming few years will continue to hamper profitability of banks. Even if the economy may recover in a “V” shape for banks, challenges would remain for the banking sector.