
Mapping Our Emotional Lives
In an era of increasingly ubiquitous technology, we are all generating a continuous stream of data. Walking down the street, we are observed by a series of closed-circuit cameras; as we make purchases, credit card records map our appetites. And most dramatically, the phones that we carry record not only our location and phone calls and text messages, but also, through social media, our emotions: likes and dislikes, jokes, desires. Facebook, says Salvatore Iaconesi, has more information about who we really are than any nation on the planet.
 Iaconesi, a 2014 Yale World Fellow, is principal and co-founder of Art Is Open Source, a network of artists and technologists exploring what the ubiquity of technology means for us as human beings. He spoke at Yale SOM on November 13, in an event hosted by the Business and Politics Club together with the Design & Innovation Club, Media & Entertainment Club, Real Estate Club, Technology Club, Education Club, and HackYaleSOM.
Today, marketers have almost exclusive access to the data we generate through social media. “Even though we, the citizens, produce all this information, we are the only ones who don’t have access to it,” Iaconesi said. Through the project Human Ecosystems, Iaconesi and his colleagues aim to make the information accessible, and intelligible, by collecting publicly available social media posts and mapping them onto physical space, with striking results.
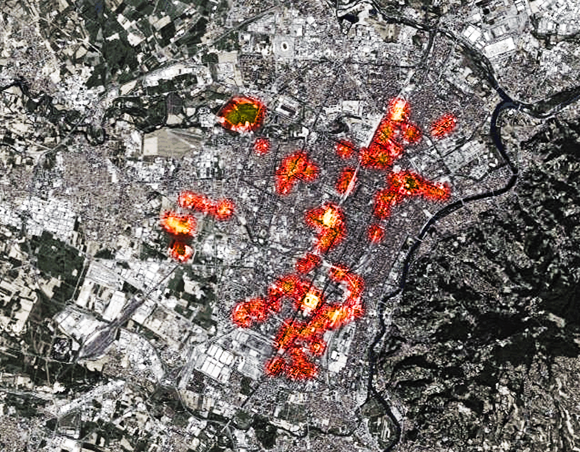
For example, Iaconesi displayed a series of heat maps of Turin, Italy, generated by marking the origin of each post. Two animated maps showed the intensity of posts in Italian versus those in Arabic over time, plotting the movement of the two communities. “They are two different cities,” Iaconesi noted. Another map showed each location in which a user described something that he or she would like to change about Turin. “If I was mayor, I would look at this map,” Iaconesi said.
In Rome, São Paulo, Hong Kong, and other cities, Human Ecosystems has collected and parsed such data, and presented it through interactive visualizations in a “Real Time Museum of the City.” Workshops help local governments, urban planners, architects, artists, and others to make use of the data.
The latest city to undergo this process is New Haven; during their stay, Iaconesi and his partner, artist and writer Oriana Persico, are collecting social media data, which will be presented in an exhibit at New Haven City Hall in December. A preliminary map showed that the epicenter of joy in the area is in Hamden, the suburb just north of New Haven. On a second map delineating anxiety, a reddish blotch was centered on the Yale campus, a palpable impression left by term papers, lab results, and midterms.